XB-IMG-122600
Xenbase Image ID: 122600

|
|
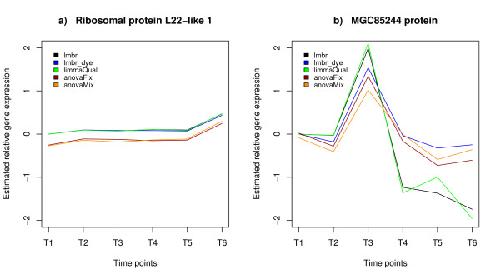
Figure 2. Examples of reconstructed profiles for two representative genes from the interwoven design. For the gene-specific methods (based on log-ratios estimate) the ratios are expressed relative to T1 and the ratio T1/T1 is set to zero. For the two-stage (ANOVA) methods, the estimated VG effect (gene-variety) is plotted. (a) Estimated profiles for the Ribosomal like gene under the interwoven design. (b) Reconstructed time profile for the gene MGC85244 under the interwoven design. Image published in: Fierro AC et al. (2008) Copyright © 2008 Fierro et al; licensee BioMed Central Ltd. Creative Commons Attribution license Larger Image Printer Friendly View |
