XB-IMG-128604
Xenbase Image ID: 128604
|
|
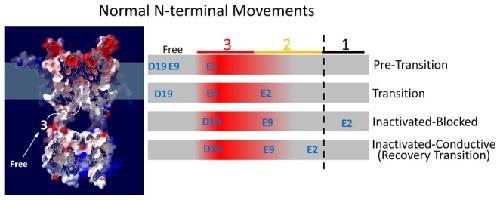
Figure 11. Model of Important Sites and Reaction Steps during N-type Inactivation.Structural model of the AKv1 channel showing the approximate locations of Sites 1, 2, and 3 along the internal aqueous pathway leading to the selectivity filter. Channel profile is taken from a slab cut from an AKv1 structural model showing a side window opening and the internal vestibule of the transmembrane pore. The 1.4 Å accessible surface map is colored according to electrostatic potential with red negative, white neutral, and blue positive. Schematic to the right lists the hypothesized locations of residues E2, E9 and D19 during different phases of the N-type inactivation cycle. The intensity of red indicates the approximate level of negative charge along the pathway relative to residues 161–3. Dashed vertical line indicates approximate location of the pore entry beyond which chain occupancy produces pore block. This picture provides an approximate explanation for the electrostatic coupling seen between these residues and 161–3 during the inactivation cycle. Precisely how this electrostatic field is actually experienced by any residue along the path will depend on the microenvironment of the N-terminal residue and the direction the residue is pointing relative to residues 161–3. Image published in: Prince A and Pfaffinger PJ (2013) Image reproduced on Xenbase with permission of the publisher and the copyright holder. Creative Commons Attribution license Larger Image Printer Friendly View |