XB-IMG-120420
Xenbase Image ID: 120420
|
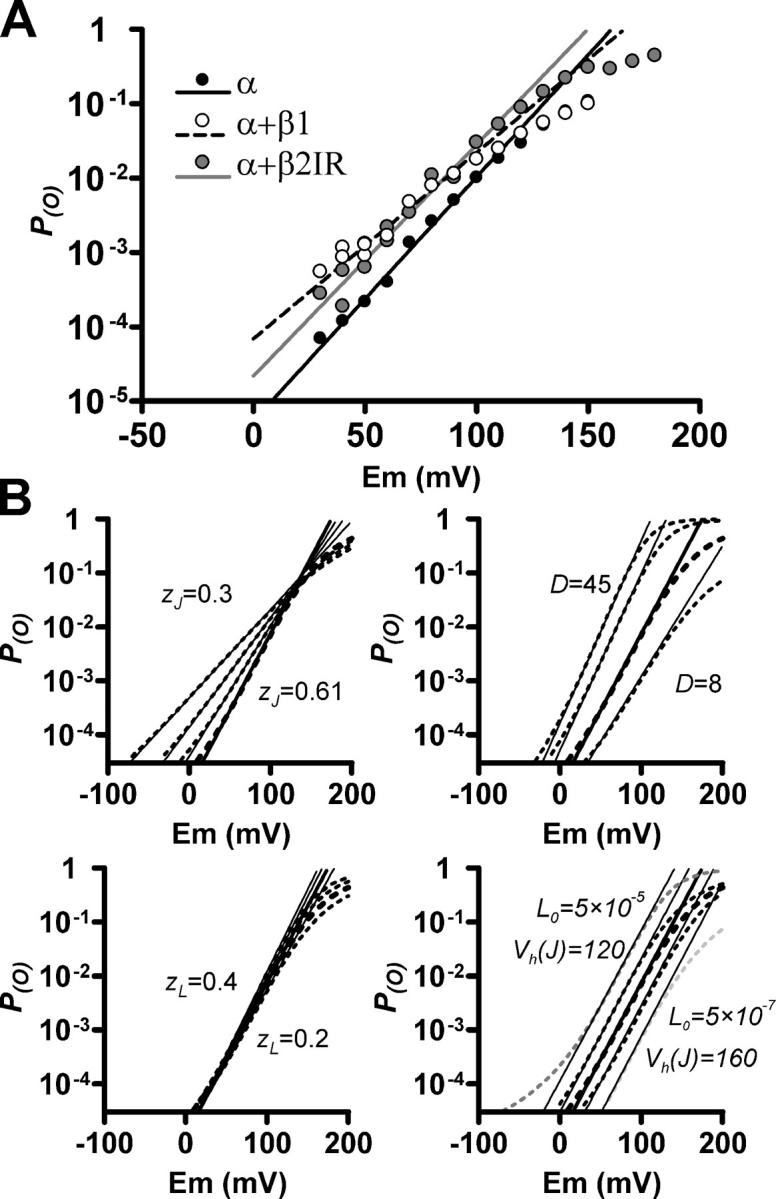
Figure 6. . The maximum slope of the ln(P(O))/V relationship is highly affected by the zJ parameter. (A) Semilogarithmic P(O)/V plots for α, α+β1, and α+β2IR channels. This is the same data as in Fig. 5 D, showing the P(O) > 10−5 range for a better appreciation of the maximum slope. Duplicate points correspond to data obtained by two different methods (unitary events quantification and macroscopic recordings). Lines represent the fit of the maximum slope found in the 0–100-mV range. (B) P(O)/V curves (dotted lines) simulated with Eq. 11 are plotted in the P(O) > 3 × 10⁻⁵ range. In each plot, the thicker dotted line is the same, corresponding to the following parameters: Vh(J) = 140 mV, zJ = 0.61, L0 = 4.7 × 10⁻⁶, zL = 0.28, and D = 14.4. Thinner dotted lines were constructed varying zJ (top left), D (top right), zL (bottom left), L0 (bottom right, gray), or Vh(J) (bottom right, black) in the indicated ranges. Continuous straight lines represent the maximum d(lnP(O))/dV value of each simulated curve. Image published in: Orio P and Latorre R (2005) Copyright © 2005, The Rockefeller University Press. Creative Commons Attribution-NonCommercial-ShareAlike license Larger Image Printer Friendly View |