XB-IMG-117396
Xenbase Image ID: 117396
|
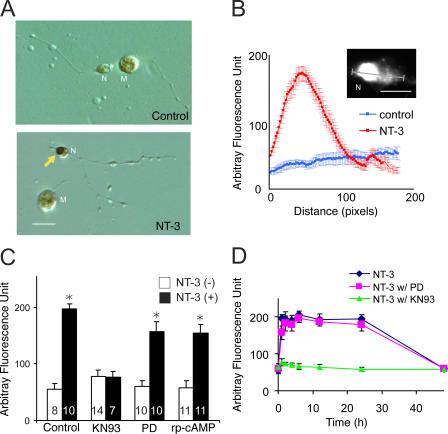
Figure 1. NT-3 activates CREB via CaMKs. X. laevis nerve-muscle cultures were treated with or without inhibitors for 1 h, followed by application of NT-3. The cultures were fixed 30 min later and processed for immunocytochemistry using anti-pCREB antibody. (A) pCREB staining images of cultures treated with or without 5 ng/ml NT-3. The yellow arrow indicates dark nuclear staining by pCREB. N, neuron; M, muscle cell. Bar, 20 μm. (B) Fluorescence intensity profiles of pCREB staining in the cell body of spinal neurons. Higher magnification of neuronal cell body is shown in the top right corner. The intensity of pCREB fluorescence was monitored along the axis drawn on the cell body of spinal neurons. Bar, 10 μm. n = 8 for untreated neurons; n = 10 for NT-3–treated neurons. (C) Quantification of peak intensity of pCREB fluorescence under various conditions. The number associated with each column represents the number of cells analyzed. *, significantly higher than the respective NT-3(–) group, by ANOVA, followed by post hoc tests; P < 0.01. (D) Time course of CREB activation upon NT-3 treatment with or without 10 μM MAPK inhibitor (PD098059) or 1 μM CaMK inhibitor (KN93). The peak intensities of pCREB fluorescence at various time points were monitored after NT-3 treatment. Data are presented as the mean ± the SEM. Image published in: Je HS et al. (2006) Copyright © 2006, The Rockefeller University Press. Creative Commons Attribution-NonCommercial-ShareAlike license Larger Image Printer Friendly View |