XB-IMG-117099
Xenbase Image ID: 117099
|
|
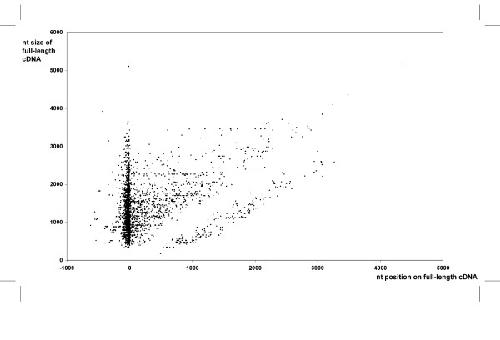
Figure 2. Added-value of xthr and xtbs 5'ESTs. 5' cDNA sequences were compared to 4,908 complete X. tropicalis cDNA sequences from XGC and Sanger Institute. When an EST matched unambiguously (>95% id over more than 50 nt on the same orientation) one of these cDNAs, the position of its first residue (X axis) was plotted as a function of the cDNA size (Y axis). Each dot represents the result of an alignment. A position of 0 on the x axis indicates identical 5' ends between the EST and cDNA. Negative values indicate that the EST extends further 5', positive values superior to the cDNA length indicate that the EST extends further 3', and positive values inferior to the cDNA size indicate the 5' EST position relative to the cDNA. Image published in: Fierro AC et al. (2007) Copyright © 2007 Fierro et al; licensee BioMed Central Ltd. Creative Commons Attribution license Larger Image Printer Friendly View |