XB-IMG-121294
Xenbase Image ID: 121294
|
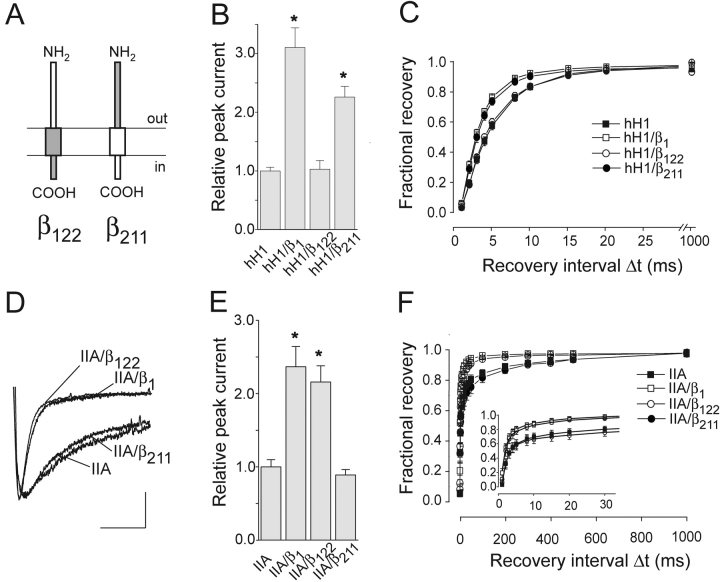
Figure 3. . Modulatory effect of chimeras β122 and β211 on hH1 and IIA channels. (A) Schematic representation of the domain structures of both chimeras. (B) Relative current amplitudes (test pulse to −25 mV; *P < 0.001; n = 55 for hH1, n = 37 for hH1/β1, n = 38 for hH1/β122, and n = 50 for hH1/β211). (C) Time course of recovery from inactivation of hH1 channels (n = 7 for hH1, n = 6 for hH1/β1, n = 5 for hH1/β122, and n = 6 for hH1/β211). (D) Effect of β122 on the inactivation time course of rat brain IIA Na+ currents (test pulse: −10 mV). Calibration bars = 5 ms, 0.25 μA for IIA, 0.52 μA for IIA/β1, 0.27 μA for IIA/β122, and 0.21 μA for IIA/β211. (E) Effect of β122 on the IIA peak current amplitude (test pulse to −10 mV; *P < 0.001; n = 19 for IIA, n = 13 for IIA/β1, n = 19 for IIA/β122, and n = 17 for IIA/β211). (F) Time course of recovery from inactivation of IIA channels. For voltage protocol, see legend to Fig. 1 (n = 13 for IIA, n = 12 for IIA/β1 and n = 12 for IIA/β122, and n = 12 for IIA/β211). Bars indicate SEM. Image published in: Zimmer T and Benndorf K (2002) Copyright © 2002, The Rockefeller University Press. Creative Commons Attribution-NonCommercial-ShareAlike license Larger Image Printer Friendly View |