XB-IMG-128681
Xenbase Image ID: 128681

|
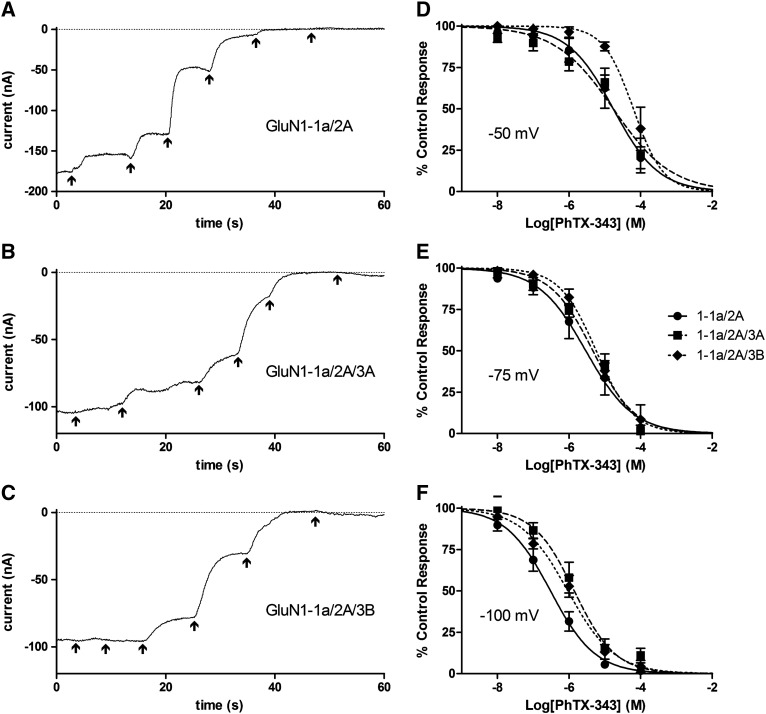
Fig. 7. Characterising the block of GluN3-lacking and GluN3-containing NMDA receptors by PhTX-343. A–C, sample traces of currents from Xenopus oocytes injected with GluN1-1A/2A (A), GluN1-1a/2A/3A (B) or GluN1-1a/2A/3B (C) and exposed to 100 μM NMDA plus 10 μM Gly with the addition of increasing concentrations of PhTX-343 (10− 8 to 10− 4 M in 10-fold increments) indicated by the arrows, with the last arrow indicating wash. Traces begin 3 s before the lowest PhTX-343 concentration was applied by which point a stable current was established; as this was after a variable period the first part of the trace is not shown. All traces were recorded at a Vh of − 75 mV. D–F, concentration–inhibition curves for PhTX-343 block of 100 μM NMDA plus 10 μM Gly currents from Xenopus oocytes injected with GluN1-1A/2A (●, solid line), GluN1-1a/2A/3A (■, broken line) or GluN1-1a/2A/3B (♦, dotted line). Points are means ± S.E.M. for 6–11 oocytes. Curves are fits to the equation given in the Materials and methods section and IC50s derived from these are given in Fig. 3. Image published in: McClymont DW et al. (2012) © 2012 Elsevier B. Creative Commons Attribution license Larger Image Printer Friendly View |
