XB-IMG-121196
Xenbase Image ID: 121196
|
|
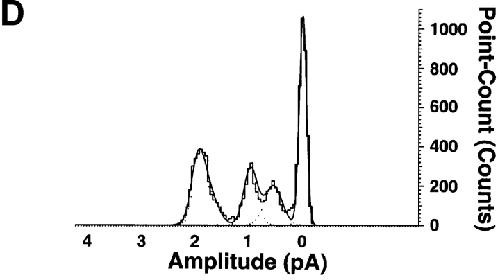
Figure 3. . Subconductances of ASIC1α. (A) Unitary currents from ASIC1α activated by pHo 6.0 and 5.0 from outside-out patches. For each example, low (500 ms) and high (50 ms) time resolution displays are shown. The dotted lines indicate current levels: a full open state (O) and three subconductance states S1, S2, and S3.. (B) Channels opening first to sublevel S1 and then to the fully open state. The example on the right shows also a transition to S3 with amplitude of 1.8 pA. (C) Examples of channel desensitization proceeding through several subconductances before the closed state is reached. (D) All points histogram of the amplitude of sublevels (in pA): S1 = 0.55, S2 = 1.0, and O = 2.0. The line represents the fit with four Gaussian components Currents were recorded with 150 mM Na+ and 0 mM Ca2+ in the outside solution and 150 mM K+ in the pipette. Pipette voltage was −60 mV. Bars indicate time and amplitude scales. For display data were filtered at 0.5 kHz. Image published in: Zhang P and Canessa CM (2002) Copyright © 2002, The Rockefeller University Press. Creative Commons Attribution-NonCommercial-ShareAlike license Larger Image Printer Friendly View |