XB-IMG-125876
Xenbase Image ID: 125876
|
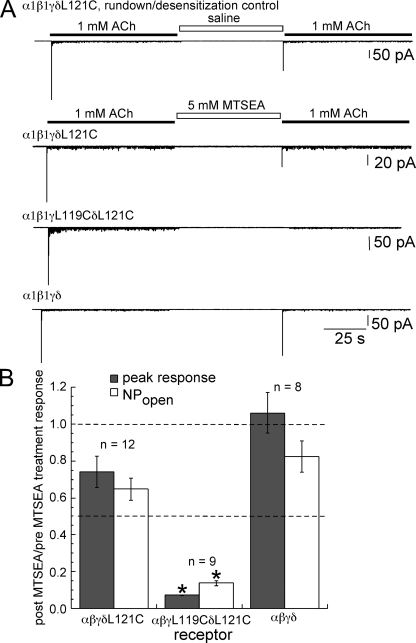
Figure 6. The effect of MTSEA treatment on peak and NPopen responses from receptors expressed in BOSC 23 cells. (A) Example traces of outside-out patches from each condition. A rapid (≤0.7-ms) drug application system was used to apply ACh and MTSEA. (B) Summary of the effect of MTSEA treatment (5 mM for 60 s) on peak current and NPopen responses to 1 mM ACh shown as the average of post-MTSEA measurements relative to the pre-MTSEA measurements of each patch. The measurements are normalized to the average peak current and NPopen responses from eight rundown/desensitization control patches. Asterisks above the values for α1β1γL119CδL121C indicate statistical significance (P < 0.01) when compared with values from either α1β1γδL121C or wild-type. See Table III for values. Image published in: Williams DK et al. (2011) © 2011 Williams et al. Creative Commons Attribution-NonCommercial-ShareAlike license Larger Image Printer Friendly View |