XB-IMG-127884
Xenbase Image ID: 127884
|
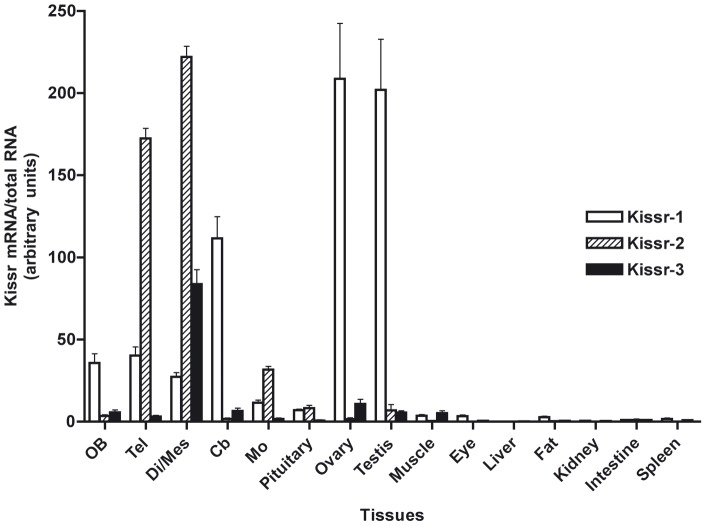
Figure 6. Tissue distribution of the expression of the three eel Kissr mRNAs.Olfactory bulbs (OB), telencephalon (Tel), di-/mes-encephalon (Di/Mes), cerebellum (Cb), medulla oblongata (MO), pituitary, ovary, testis, muscle, eye, liver, adipose tissue (Fat), kidney, intestine and spleen. The relative expression of each Kissr mRNA was normalised to the amount of total RNA. Each bar represents mean ± SEM from 8 individuals. Image published in: Pasquier J et al. (2012) Image reproduced on Xenbase with permission of the publisher and the copyright holder. Creative Commons Attribution license Larger Image Printer Friendly View |