XB-IMG-121043
Xenbase Image ID: 121043
|
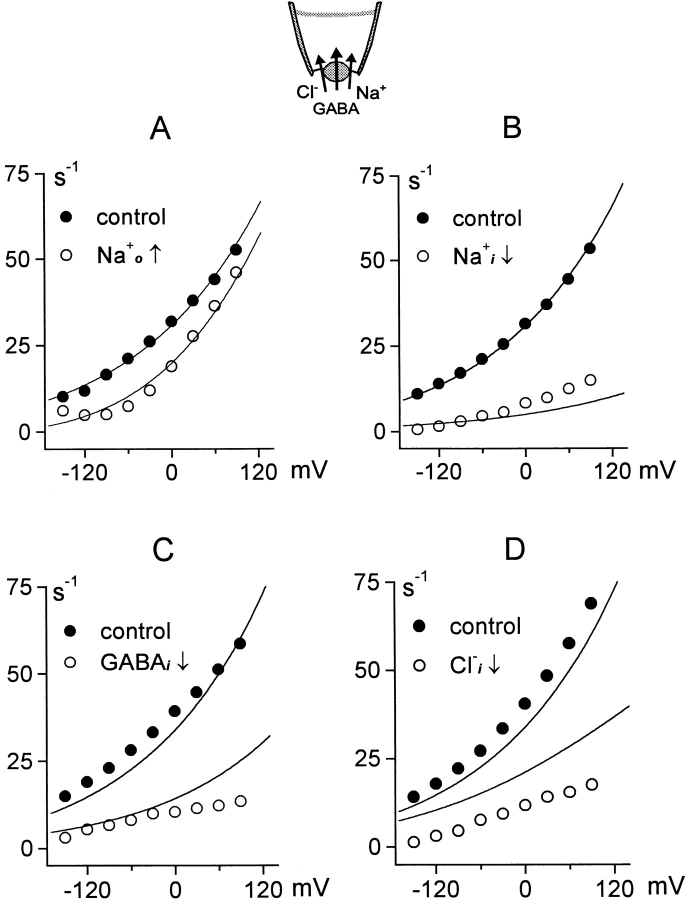
Figure 6. Current–voltage relations of outward GAT1 current. Fully activated outward current (120 mM NaCl and 20 mM GABA) is plotted in each case (•). (A) Inhibition of outward current by 100 mM extracellular Na+. (B) Inhibition of outward current by reducing the cytoplasmic Na+ concentration from 120 to 20 mM. (C) Inhibition of outward current by reducing cytoplasmic GABA from 20 to 0.5 mM. (D) Inhibition of outward current by reducing cytoplasmic Cl− from 120 to 15 mM. See text for further details. Image published in: Hilgemann DW and Lu CC (1999) © 1999 The Rockefeller University Press. Creative Commons Attribution-NonCommercial-ShareAlike license Larger Image Printer Friendly View |