XB-IMG-127949
Xenbase Image ID: 127949
|
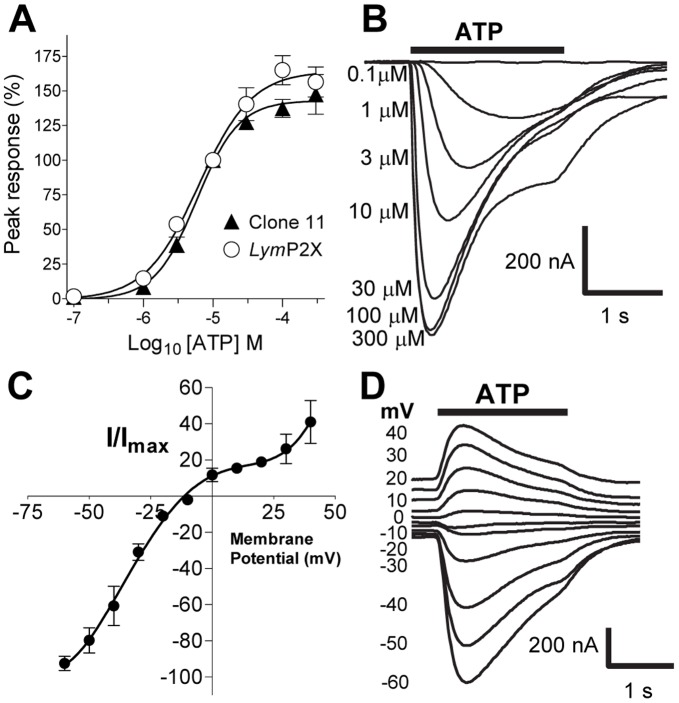
Figure 4. Properties of ATP evoked currents.(A) Concentration response curves for ATP in LymP2X expressing oocytes. Mean peak currents (± s.e.m) were normalized to responses evoked by 10 µM ATP, EC50 = 6.2 µM for LymP2X (n = 10 oocytes) and 5.8 µM for clone 11 (n = 5). B) Example LymP2X current traces in response to different concentrations of ATP (black bar). (C) Current voltage relationship of LymP2X. The reversal potential of ATP mediated currents was determined by recording ATP (10 µM, indicated by bar) induced currents at holding potentials ranging from –60 mV to +40 mV with a 5 minute interval between applications. Currents obtained in different oocytes were expressed as a negative percentage of the maximum current for each individual cell (n = 7). D. Example currents for the plot depicted in C. Image published in: Bavan S et al. (2012) Image reproduced on Xenbase with permission of the publisher and the copyright holder. Creative Commons Attribution license Larger Image Printer Friendly View |