XB-IMG-127260
Xenbase Image ID: 127260

|
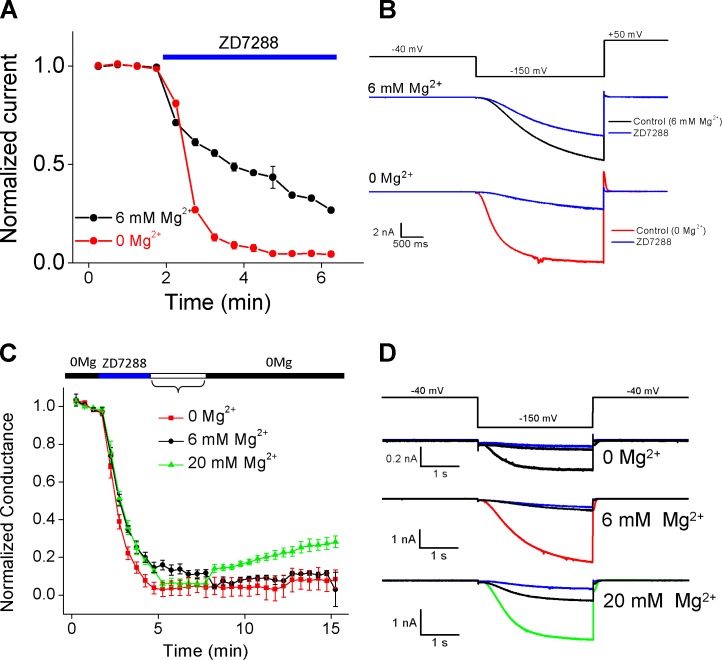
Figure 3. Intracellular Mg2+ reduces the efficacy of ZD7288 in blocking HCN channel conductance. (A) Macroscopic currents blocked by 100 µM ZD7288 (application indicated by the blue bar). The black line indicates 6 mM Mg2+ added in the bath solution; the red line indicates 0 Mg2+. The difference between 0 Mg2+ and 6 Mg2+ at time 255 s is statistically significant (independent samples t test: t = 13.85, P < 0.01). (B, top) Voltage protocol used. (middle) Current traces recorded with 6 mM Mg2+ in the bath solution. (bottom) 0 Mg2+. Current traces recorded with ZD7288 are shown in blue. Control traces without ZD7288 are shown in either black (6 mM Mg2+) or red (0 Mg2+). (C) Washing off the ZD7288 block (blue bar) by exposing the membrane patch to different concentrations of Mg2+ (open bar). The red line indicates without Mg2+; the black line indicates 6 mM Mg2+; the green line indicates 20 mM Mg2+. Recovery of HCN current was tested in the absence of Mg2+. (A and C) Error bars indicate standard error. (D) Corresponding voltage protocol and representative current traces. Image published in: Wu S et al. (2012) © 2012 Wu et al. Creative Commons Attribution-NonCommercial-ShareAlike license Larger Image Printer Friendly View |
