XB-IMG-117678
Xenbase Image ID: 117678
|
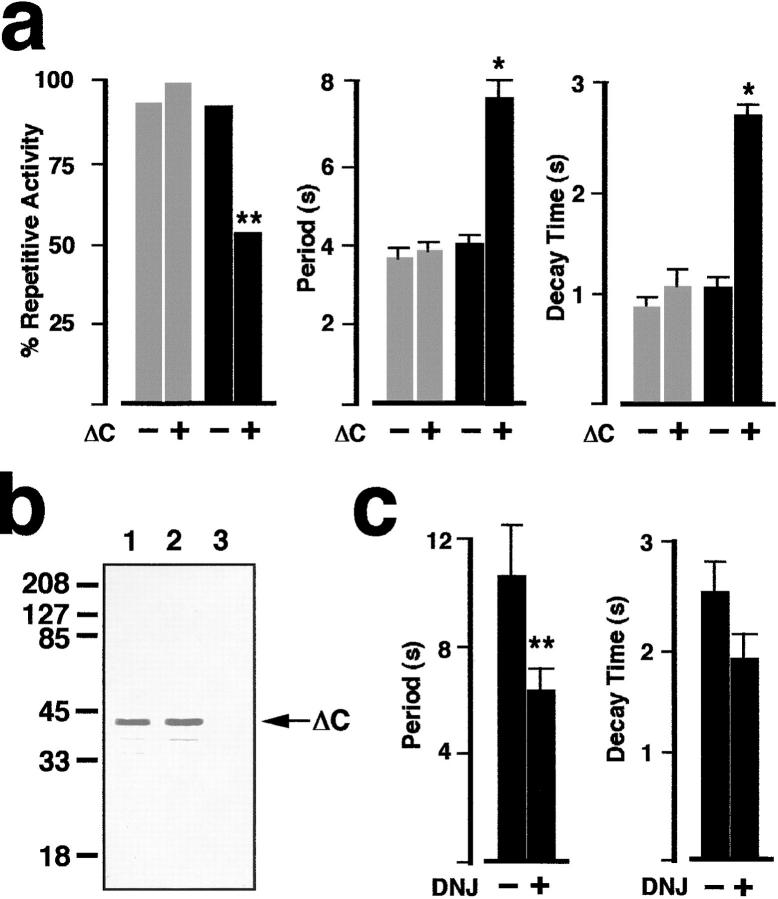
Figure 5. ΔC inhibition of repetitive Ca2+ waves and reversal of the ΔC effect by glucosidase inhibitors. (a) The percent of oocytes exhibiting repetitive Ca2+ oscillations is significantly reduced in oocytes coexpressing ΔC with SERCA2b (black bars), but not in oocytes coexpressing ΔC with SERCA2a (gray bars; **P < 0.01, Chi-squared test). Of those oocytes that did display repetitive Ca2+ oscillations, the interwave period (middle histogram) and decay time (right histogram) were significantly increased in oocytes coexpressing ΔC with SERCA2b when compared with control oocytes overexpressing SERCA2b alone (*P < 0.005). No significant differences were found between oocytes coexpressing ΔC with SERCA2a as compared with control oocytes overexpressing SERCA2a alone in either interwave period or in decay time of individual waves. Note that there is a change in scale values for the ordinate in histograms of wave period and decay time with respect to Fig. 3 c. The larger scale in this figure reflects the longer period and longer decay time of Ca2+ waves in SERCA2b + ΔC-overexpressing oocytes. (b) Western blot analysis demonstrates overexpression of the ΔC mutant of CRT in fractions from oocytes coexpressing this calreticulin mutant with SERCA2a (lane 1) and SERCA2b (lane 2). Oocyte extracts from control oocytes (H2O replacing mRNA) were run on lane 3. The membrane was probed with a primary anti-CRT KDEL Ab that recognizes the last six amino acids at the COOH terminus of rabbit CRT (gift of Michalak). (c) Glucosidase inhibition antagonizes the effects of ΔC overexpression on oscillatory Ca2+ waves. Period between waves in SERCA2b + ΔC-overexpressing oocytes is significantly decreased (n = 13) in oocytes injected with 1 mM final DNJ (Toronto Research Chemicals, North York, Ontario, Canada) when compared with uninjected SERCA2b + ΔC control oocytes (n = 18). **Indicates statistical significance at P < 0.025. In the same groups of oocytes, decay time of individual Ca2+ waves is also reduced, although the differences are not statistically significant. Image published in: John LM et al. (1998) Image reproduced on Xenbase with permission of the publisher and the copyright holder. Creative Commons Attribution-NonCommercial-ShareAlike license Larger Image Printer Friendly View |