XB-IMG-176117
Xenbase Image ID: 176117

|
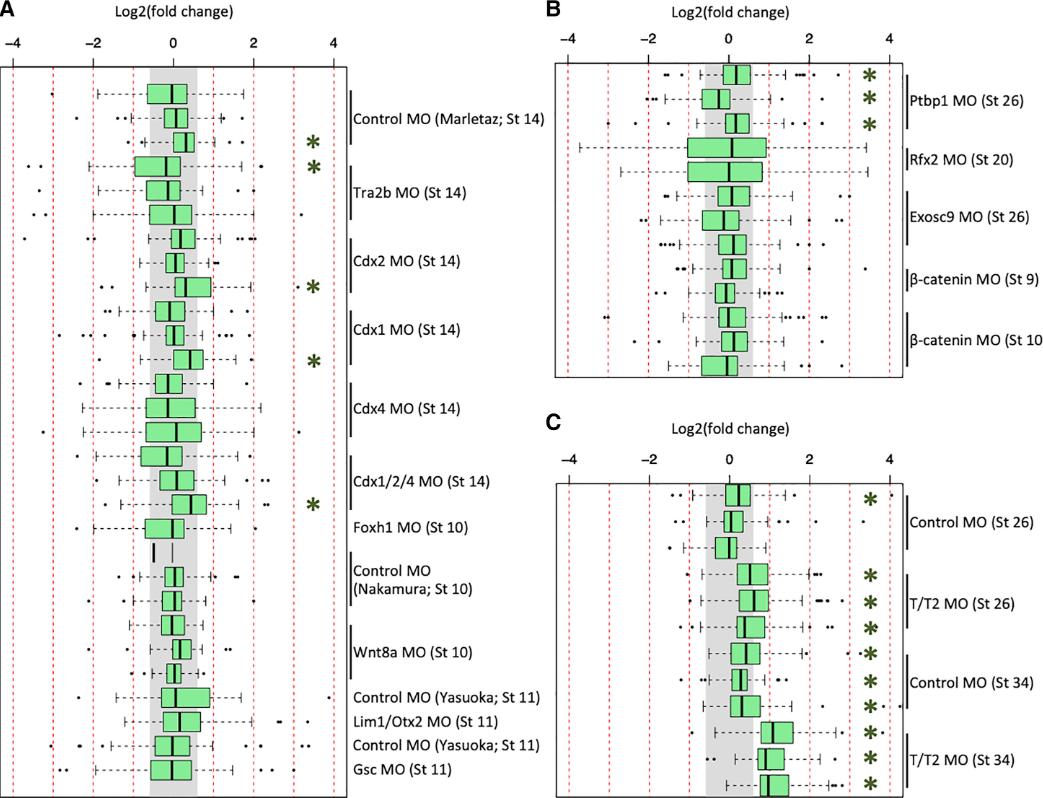
Figure 2. Expression of GO-Identified Innate Immune Response Genes in X. tropicalis and X. laevis RNA-Seq Datasets
(A–C) Fold-change expression of innate immune response genes across 29 datasets in X. tropicalis (A), across 13 datasets in X. laevis (B), and in 12 of the tbxt/t2 MO datasets (C). The gray region indicates fold change of <1.5×. Green asterisk (∗) indicates a t test p value of <0.01. Image published in: Paraiso KD et al. (2019) Copyright © 2019. Image reproduced with permission of the Publisher, Elsevier B. V. Larger Image Printer Friendly View |
