XB-IMG-125914
Xenbase Image ID: 125914

|
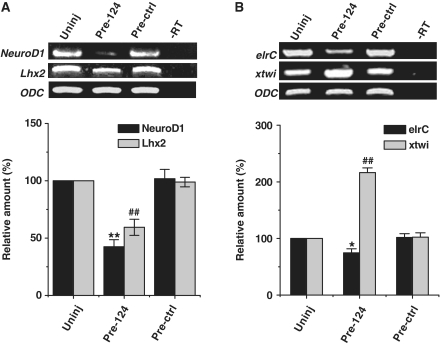
Figure 3. MiR-124 overexpression reduces the expression of NeuroD1. RT–PCR (gel panel) and real-time PCR (bar graph) conditions are the same as those in Figure 2. (A) Gain of miR-124 resulted in downregulation of both NeuroD1and Lhx2 at Stages 22/23. (B) Expression of elrC decreased and that of xtwi increased. *P and #P < 0.05; **P and ##P < 0.01. Image published in: Liu K et al. (2011) © The Author(s) 2010. Creative Commons Attribution-NonCommercial license Larger Image Printer Friendly View |
