XB-IMG-116900
Xenbase Image ID: 116900
|
|
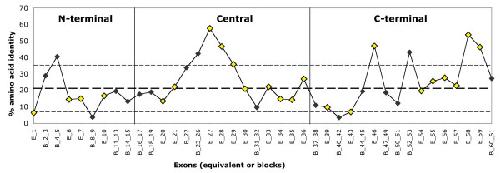
Figure 4. Percentage amino acid identity calculated for each Equivalent exon (E, in yellow) and exon-Block (B, in gray). The percentage amino acid identity was calculated from the chordate protein alignment for each of the equivalent exons and exon-blocks described in Figure 1. Numbers refer to the Ciona exon numbering. Bold-dashed line represents the mean % identity (21.2%) calculated over the entire alignment length. Normal-dashed lines represent mean value +/- standard deviation (7.1). Image published in: Gissi C et al. (2006) Copyright © 2006 Gissi et al; licensee BioMed Central Ltd. Creative Commons Attribution license Larger Image Printer Friendly View |