XB-IMG-123632
Xenbase Image ID: 123632
|
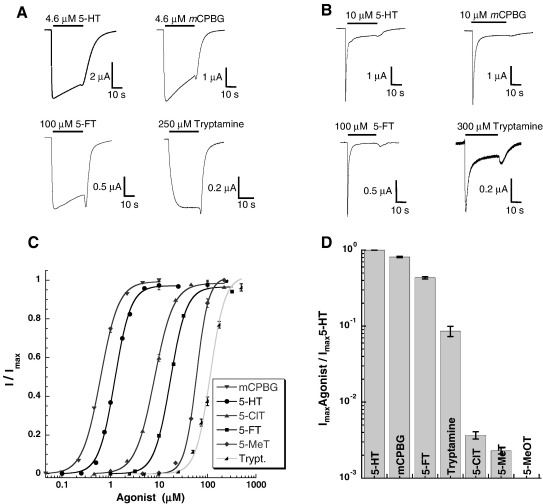
Fig. 2. Properties of 5-HT3A and 5-HT3AB receptors expressed in Xenopus oocytes. Typical responses to maximal concentrations of 5-HT, mCPBG, 5-FT and tryptamine in (A) 5-HT3A and (B) 5-HT3AB receptors; (C) Concentration–response curves in 5-HT3A receptors; (D) Relative efficacies (Rmax) of agonists compared to 5-HT. Image published in: Bower KS et al. (2008) © 2008 Elsevier B. Creative Commons Attribution license Larger Image Printer Friendly View |