XB-IMG-127829
Xenbase Image ID: 127829

|
|
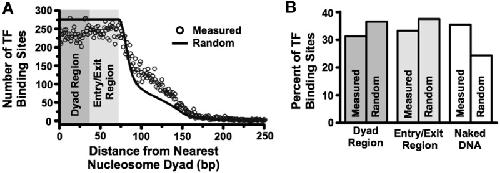
Figure 5. TF-binding sites predominantly reside within nucleosomes. (A) Distribution of TF-binding site distances from the nearest nucleosome dyad (black circles), with distances of 0–36 bases considered within the dyad region, distances of 37–74 bases considered within the entry–exit region, and distance greater than 74 bases considered to be in naked DNA (see Experimental Procedures and Supplementary Figure S5 for details). The black line represents the expected TF-binding site distribution if they were distributed randomly throughout the genome. (B) Measured and expected percentages of TFs in each region calculated from the distribution in (A). Image published in: North JA et al. (2012) © The Author(s) 2012. Creative Commons Attribution-NonCommercial license Larger Image Printer Friendly View |
