XB-IMG-124087
Xenbase Image ID: 124087
|
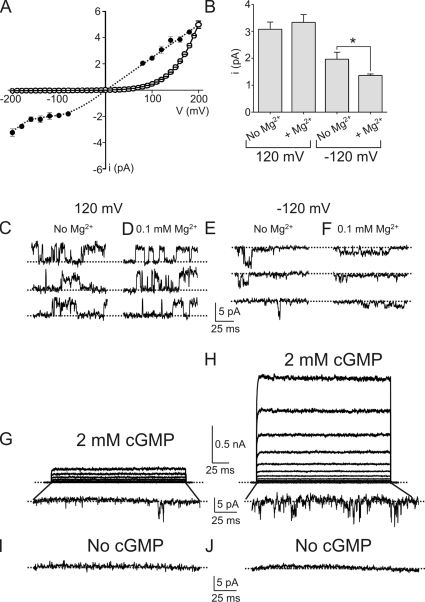
Figure 4. Macroscopic rectification of the E363Q mutant reflects voltage gating, not asymmetric ion conduction. (A) Single-channel i-V curve (mean ± SEM; n = 4–7) of the E363Q mutant (filled circles) and the (arbitrarily scaled) macroscopic I-V curve (mean ± SEM; n = 5) in the presence of 2 mM cGMP (open circles). The dotted line through the single-channel data points is hand drawn. (B) Single-channel current amplitude of the E363Q mutant (mean ± SEM; n = 5–20) at 120 or −120 mV and in the presence or absence of 0.1 mM of extracellular Mg2+. *, P < 0.001 (one-way ANOVA). (C–F) Representative single-channel currents of the E363Q mutant recorded at 120 mV (C and D) or −120 mV (E and F) and in the absence (C and E) or presence (D and F) of 0.1 mM of extracellular Mg2+; each trace was recorded from a separate inside-out patch. (G–J) Longer-duration macroscopic current traces recorded in 2 mM cGMP (G and H) from membrane patches of two oocytes expressing different densities of E363Q channels. Traces at −200 mV were magnified to show individual channel activity; the control traces recorded from the same patches at −200 mV and in the absence of cGMP are shown below (I and J). Image published in: Martínez-François JR et al. (2009) © 2009 Martínez-François et al. Creative Commons Attribution-NonCommercial-ShareAlike license Larger Image Printer Friendly View |