XB-IMG-125755
Xenbase Image ID: 125755
|
|
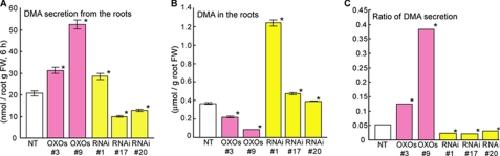
FIGURE 8. Analysis of levels of endogenous DMA in and DMA secretion from Fe-deficient OXOs, OXHv, RNAi, and NT plant roots after a 6-h exposure to light. A, secreted DMA. B, endogenous DMA. C, fraction of the total DMA synthesized in the root that was secreted. Values shown represent the means of three replicates. Error bars represent S.D. *, significant difference (p < 0.01) by Student's t test. Image published in: Nozoye T et al. (2011) © 2011 by The American Society for Biochemistry and Molecular Biology, Inc. Creative Commons Attribution-NonCommercial license Larger Image Printer Friendly View |