XB-IMG-120258
Xenbase Image ID: 120258

|
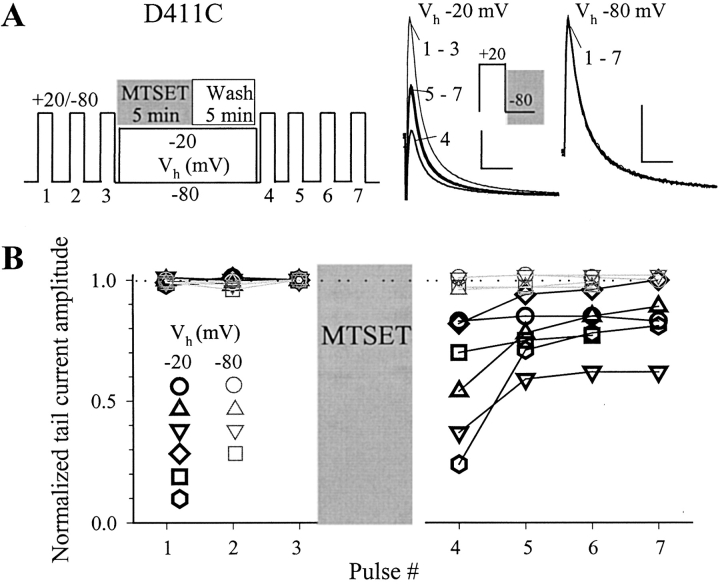
Figure 9. . Testing the accessibility of thiol side chain at position 411 to extracellular MTSET. (A) Left, experimental protocol. Right, superimposed tail current traces (at −80 mV, gray shade in inset) recorded from two experiments. The Vh and pulse numbers are marked. (B) Summary data. The peak amplitudes of tail currents are normalized by the control value just before MTSET application, and plotted against pulse numbers. Data points from different experiments are denoted by different symbols as denoted in the inset (n = 6 for Vh −20 mV, and n = 4 for Vh −80 mV). Calibration bars correspond to 1 μA and 0.1 s. Image published in: Liu J et al. (2003) Copyright © 2003, The Rockefeller University Press. Creative Commons Attribution-NonCommercial-ShareAlike license Larger Image Printer Friendly View |
