XB-IMG-124130
Xenbase Image ID: 124130

|
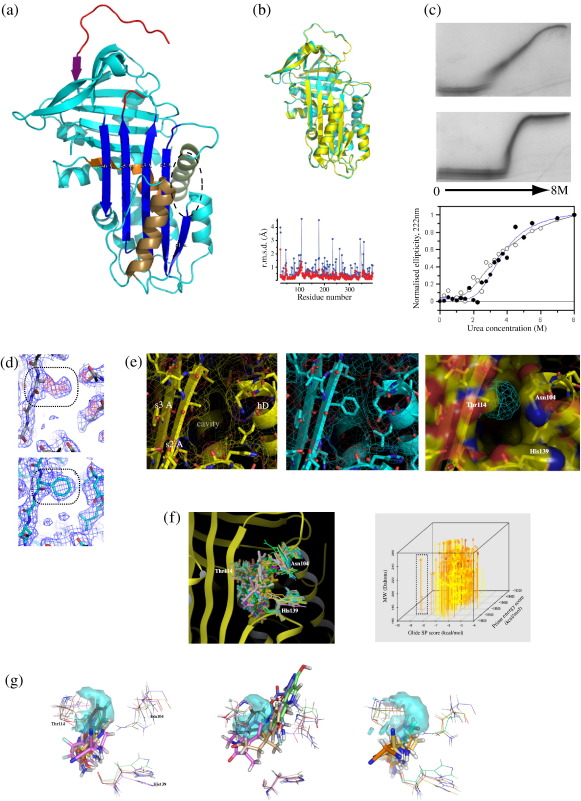
Fig. 1. Structure of Thr114Phe α1-antitrypsin and in silico fragment screen. (a) Crystal structure of Thr114Phe α1-antitrypsin shown in cyan with key structural features coloured. The reactive loop is depicted in red, β-sheet A in dark blue, the shutter region in orange, helix D in green, helix F in bronze and strand 1 of β-sheet C (s1C) in purple. The cavity flanking β-sheet A is indicated (ellipse). (b) Superposition of wild-type (PDB code: 1QLP,16 yellow) and Thr114Phe (cyan) α1-antitrypsin with plot of the r.m.s.d. between the main chains (red) and side chains (blue). (c) Increased stability of the native fold in the presence of the Thr114Phe mutation. TUG-PAGE of wild-type (upper panel) and Thr114Phe (middle panel) α1-antitrypsin indicates that the mutation confers increased stability of the native fold to increasing urea concentration. CD spectroscopy allows urea stability to be compared more directly. Ellipticity values measured at 222 nm with varying urea concentrations are shown for wild-type and Thr114Phe α1-antitrypsin (n = 3). Values are normalised to allow direct comparison of the loss of initial signal. Curves were fitted in Grafit 3.0 (Erithacus Software Ltd.) using an equation modelling a simple two-state denaturation as described previously.8 Unfolding measured by this method commenced at 0.7 M urea for the wild-type protein (black curve, open circles) and 1.2 M urea for Thr114Phe α1-antitrypsin (blue curve, filled circles). The transition midpoints (assuming complete unfolding at 8 M urea) were reached at similar points (3.4 M urea for wild-type α1-antitrypsin and 3.5 M for Thr114Phe α1-antitrypsin) in both profiles. (d) Electron density for the Thr114Phe mutation site (boxed) prior to restrained refinement (upper panel). The 2.0-Å structure of wild-type α1-antitrypsin (1QLP with the mutation site modelled as an alanine was used as the search model, giving the 2Fo − Fc electron density map shown in dark blue (contoured at 1 σ). Positive density for the phenylalanine residue appears in the Fo − Fc difference map shown in red (contoured at 3 σ). The same site is shown in the refined structure (lower panel). (e) The surface-accessible cavity flanking β-sheet A, shown in close up for wild-type (left panel, yellow) and in the refined structure of Thr114Phe (middle panel, cyan) α1-antitrypsin with side chains and electrostatic surfaces. The volume occupied by the Thr114Phe mutation within the cavity defines a pharmacophore target for screening of fragment compounds to mimic its effects [right panel, cyan mesh, within the wild-type α1-antitrypsin cavity (transparent surface representation)]. (f) Results of proof-of-principle fragment screen. Left panel: Ensemble of the 65 highest-scoring ligands successfully docked using the induced fit protocol. Right panel: 4-D plot showing characteristics of these ligands (results shown correspond to 903 poses). All are highly drug-like and favourable for drug development according to the Rule of 517 and the Rule of 3.18 Heat map colouring indicates ligand–target centroid proximity (≥ 5.0 Å, yellow; 2.5–5.0 Å, orange; ≤ 2.5 Å, red). Glide docking score values < − 6.8 kcal/mol correspond to micromolar binding constants, and values below − 8.2 kcal/mol are consistent with predicted submicromolar Kd. Closer proximity to the pharmacophore target site indicates increased likelihood of a docked moiety mimicking effects of the Thr114Phe mutation. Smaller ligands allow more extensive structural optimisation during drug design.19 Four ligands that formed an outlier group in terms of particularly scoring using both Glide SP and Prime scoring algorithms are indicated (box). (g) Examples of ligands with favourable characteristics following induced fit docking. The pharmacophore target is represented as a transparent cyan surface, and ‘receptor residues’ (Asn104, Thr114 and His139) are shown as optimised for each ligand. Ligand colours correspond to those of receptor site residues optimised for their binding. Non-carbon atoms are individually coloured (oxygen, red; nitrogen, dark blue; fluorine, light blue; sulfur, orange). Left panel: the five ligands top-ranked by Glide SP docking score. Middle panel: the five ligands top-ranked by proximity of ligand to the pharmacophore target. Right panel: the ‘favourable outlier group’ defined in (f). Image published in: Gooptu B et al. (2009) © 2009 Elsevier Ltd. Creative Commons Attribution license Larger Image Printer Friendly View |
