XB-IMG-121754
Xenbase Image ID: 121754
|
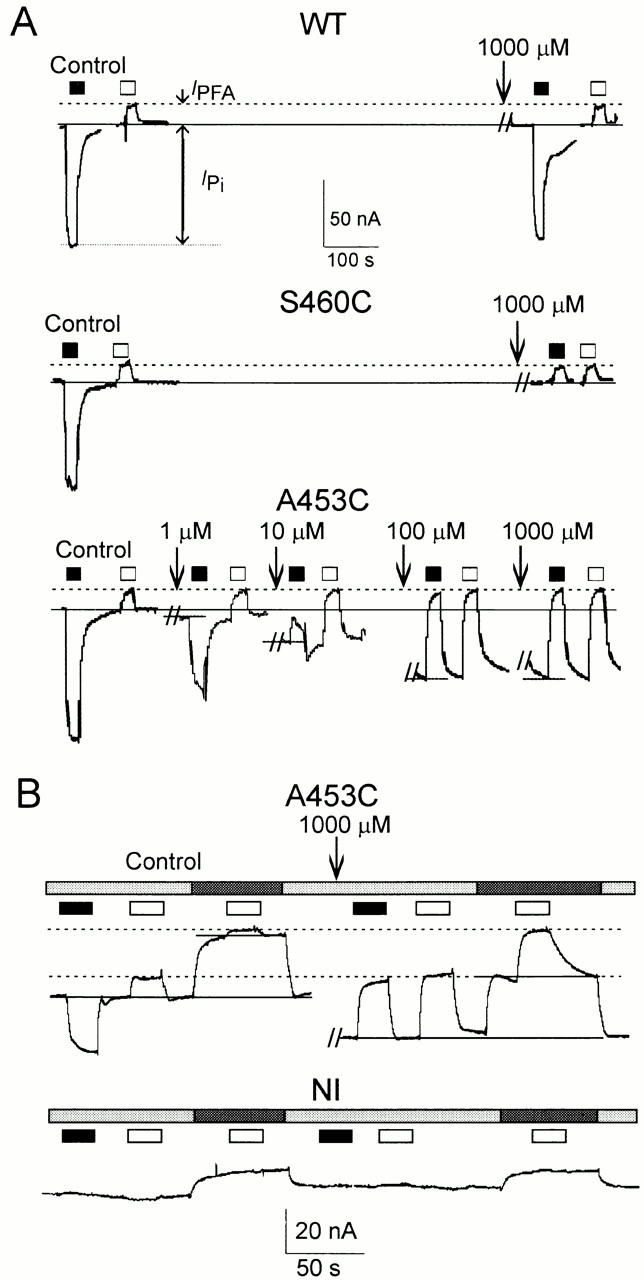
Figure 3. Effect on electrogenic response of incubation in MTS reagents. (A) Excerpts from continuous recordings made from representative oocytes that expressed the WT (top), S460C (center), and A453C (bottom) constructs, respectively. After a control application, substrates Pi (1 mM) (filled bars) and PFA (3 mM) (empty bars) were applied successively and tested after incubation (vertical arrows) in MTSEA for 3 min and washout at the concentration indicated. Only the baseline that immediately preceded application and washout of the test substrates is shown. The dashed line indicates holding current reached during control PFA application. Continuous line indicates initial holding current in ND100 superfusate. No external adjustment of current offset was made during the recording period. Cells were continuously voltage clamped to −50 mV during whole experiment; records were low-pass filtered at 20 Hz, sampling 2 ms/point. IPFA and IPi are the changes in holding current induced by Pi and PFA, respectively, relative to the holding current in ND100. (B) Excerpts from two contiguous recordings that illustrate the effect of changing external Na+ on slippage before and after MTSEA exposure to an oocyte that expressed A453C and a noninjected (NI) oocyte. The external solutions were changed as indicated: ND100 (light gray bars), ND50 (dark gray bars), Pi (1 mM) (filled bars), PFA (3 mM) (empty bars). Dotted lines indicate holding currents reached during PFA, continuous lines indicate current level in the absence of test substrate. Image published in: Lambert G et al. (2001) © 2001 The Rockefeller University Press. Creative Commons Attribution-NonCommercial-ShareAlike license Larger Image Printer Friendly View |