XB-IMG-124703
Xenbase Image ID: 124703
|
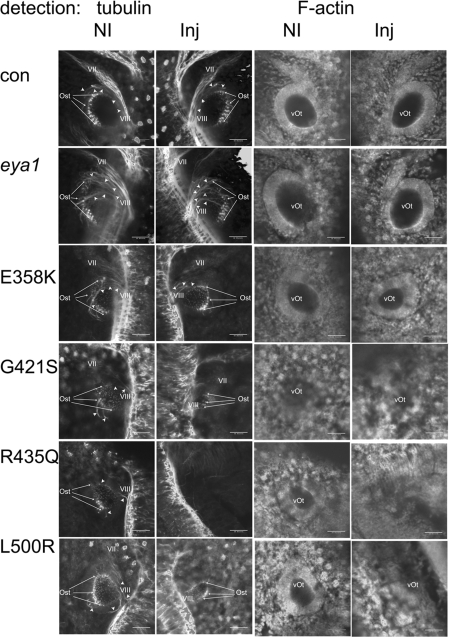
Figure 5. Stage 32 otic development is disrupted by eya1 mutants linked to BORStage 32 embryos were imaged using a confocal microscope from the dorsal–lateral prospect. The anterior of the embryo is towards the top of each image. Dual panels on the left show tubulin distribution; dual panels on the right detect F-actin. In each dual set, the non-injected side (NI) of the embryo is on the left and the injected side (Inj) is on the right. Material injected into the right side of the embryo is indicated for each row of panels. In panels detecting tubulin, the cranial nerves (VII and VIII) are labelled when visible. The label for VIII is placed as close to the attachment to the spcd as possible. Otic sensory tissue (Ost) is pointed out using arrows that help indicate the most anterior and posterior extents of this tissue type. Arrowheads indicate neurites that are associated with sensory tissue and VIII. The otic vesicle (vOt) is labelled where visible on panels showing F-actin. Scale bars, 50 μm. (Note: the right panel for non-injected controls are also shown enlarged in Figures 3E and 3G.) con, control. Image published in: Li Y et al. (2010) © 2010 The Author(s) The author(s) has paid for this article to be freely available under the terms of the Creative Commons Attribution Non-Commercial Licence (http://creativecommons. Creative Commons Attribution-NonCommercial license Larger Image Printer Friendly View |