XB-IMG-126010
Xenbase Image ID: 126010
|
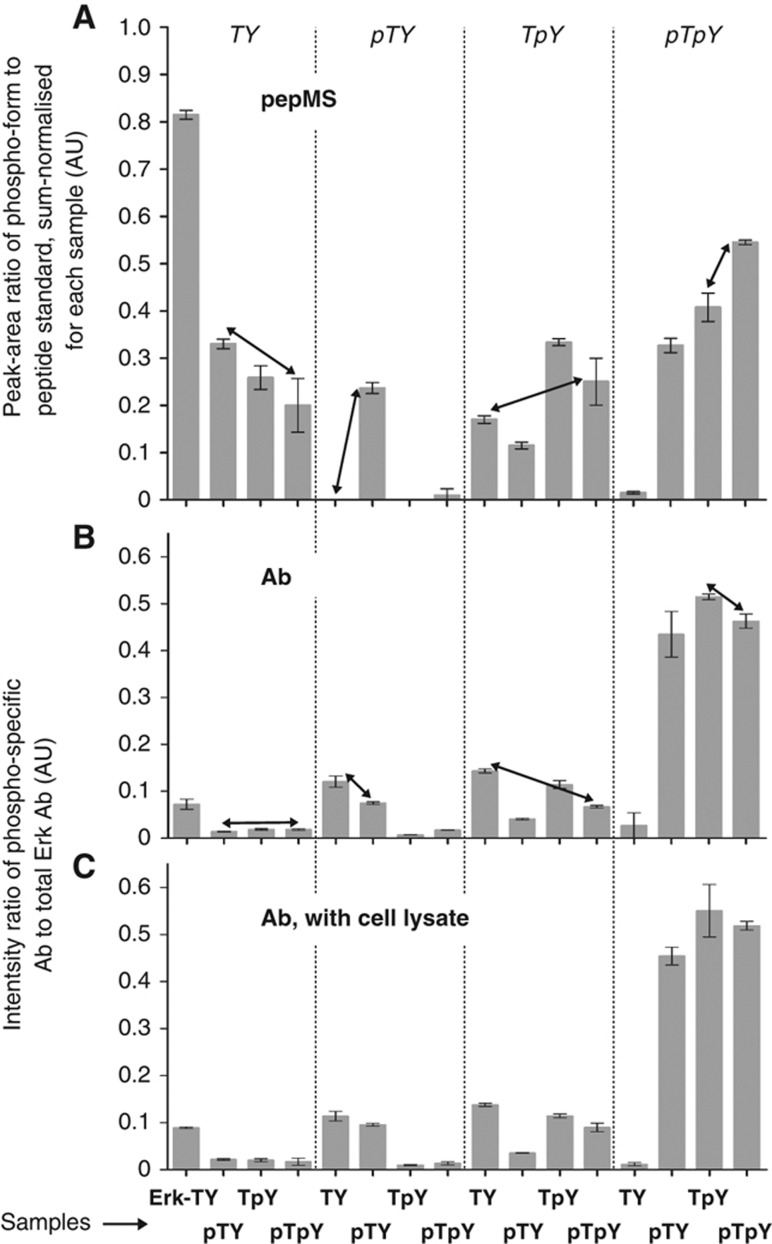
Figure 3. Comparison of pepMS and antibodies. (A) Rearrangement of the phospho-form distributions (Supplementary Figure 3) of the second, non-isotopically labelled sample set. For each phospho-form listed at the top of each sub-panel, the normalised values of the phospho-form for each sample are collected together. Samples are listed at the bottom of the figure. (B) Antibody data for the second sample set, as in Figure 1D. (C) Antibody data for the second sample set, after spiking with whole-cell lysate. The vertical scales for B and C lie between 0 and 1 only by coincidence; there is no sum-normalisation, as there is for A. The arrows show comparisons discussed in the text. Similar results were obtained using HRP-conjugated antibodies and CCD imaging (Supplementary Figure 4). Source data is available for this figure at www.nature.com/msb.Source data for Figure 3B. Source data for Figure 3C. Image published in: Prabakaran S et al. (2011) Copyright © 2011, EMBO and Macmillan Publishers Limited. Creative Commons Attribution-NonCommercial-NoDerivatives license Larger Image Printer Friendly View |