XB-IMG-123415
Xenbase Image ID: 123415

|
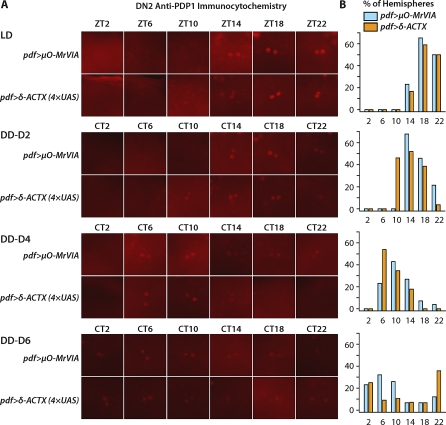
Figure 12. Membrane-Tethered δ-ACTX-Hv1a Expression in LNV Neurons Induces Short Period of PDP1 Oscillation in DN2s in DDRed anti-PDP1 immunofluorescence (A) reveals PDP1 accumulation in DN2 nuclei. Bar graphs (B) show the percentage of brain hemispheres with an identified pair of anatomically distinguishable PDP1-positive DN2s. The DN2s of control pdf>μO-MrVIA flies drift out of phase with the 24-h day and the other cell groups, exhibiting peak PDP1 accumulation at CT14 on DD-D2, CT10 on DD-D4, and CT6 on DD-D6. The DN2s of experimental pdf>δ-ACTX-Hv1a flies exhibit a similar temporal pattern of PDP1 accumulation to control flies in LD. In DD conditions, PDP1 accumulation in DN2s of pdf>δ-ACTX-Hv1a flies phase advance more rapidly than control flies, with peak at CT10–CT14 on DD-D2, CT6 on DD-D4, and CT22 on DD-D6 (p < 0.01, χ2). n >22 brain hemispheres for each experimental group and error bars indicate SEM. Image published in: Wu Y et al. (2008) Copyright: © 2008 Wu et al. Creative Commons Attribution license Larger Image Printer Friendly View |
