XB-IMG-122896
Xenbase Image ID: 122896
|
|
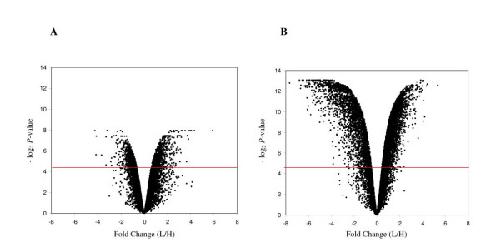
Figure 1. Volcano plots of gene expression. Volcano plots from FDR corrected t-tests of statistical significance (vertical axis) against magnitude of expression change (horizontal axis), where each point corresponds to a gene/transcript. Expression change (fold-change) is defined as a log2-transformed ratio of mean nonhybrid to mean hybrid expression level. (A) Xenopus laevis (L) vs. Hybrids (H); (B) Xenpous muelleri (M) vs. Hybrids (H). The red horizontal line denotes FDR adjusted alpha 0.05. The horizontal deviation from 0 towards the right or left reflects hybrid underexpression or overexpression, respectively. Image published in: Malone JH and Michalak P (2008) Copyright ©2008 Malone and Michalak; licensee BioMed Central Ltd. Creative Commons Attribution license Larger Image Printer Friendly View |