XB-IMG-124042
Xenbase Image ID: 124042
|
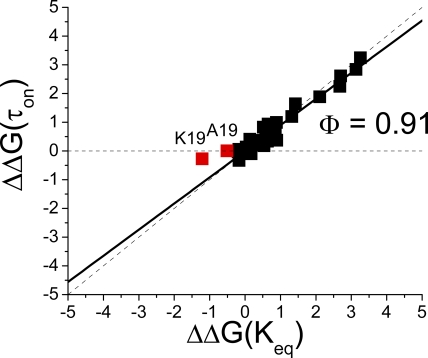
Figure 10. Linear energy plot for all mutations made to polar region–charged residues. In Tables II and IV, values for energetic effects of polar region mutations on τon and Keq are plotted. Plot shows the change in on and equilibrium energy compared with the base construct for every mutation we constructed in the polar region of the AKv1 N terminus. Mutations cluster tightly near the Φ =1 line with a slope of 0.91, indicating that as a group, polar region mutations primarily impact a step early in the inactivation process and do not alter the energetics for recovery. Residue 19 mutations may be plotting along a shallower line, indicating that they also affect a later step in the inactivation process. Image published in: Prince-Carter A and Pfaffinger PJ (2009) © 2009 Prince-Carter and Pfaffinger. Creative Commons Attribution-NonCommercial-ShareAlike license Larger Image Printer Friendly View |