XB-IMG-121149
Xenbase Image ID: 121149
|
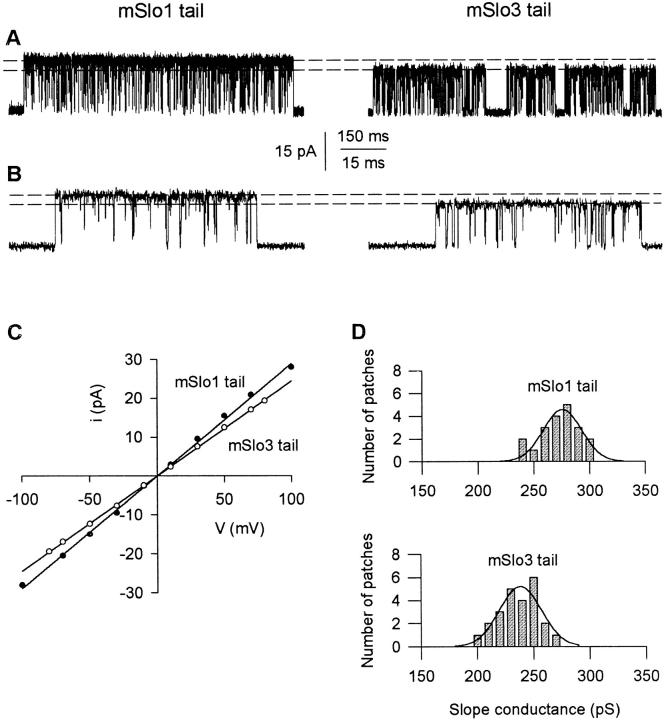
Figure 11. Replacing the mSlo1 tail with the mSlo3 tail decreases single-channel conductance. (A) Single-channel current recordings from a single mSlo1 tail channel and a single mSlo3 tail channel. The dashed lines indicate the maximum current amplitude observed for each channel type. Membrane potential: +70 mV. Records were low-pass filtered at 5 kHz. (B) Representative bursts from A on a faster time base. (C) Plots of single-channel current amplitude versus membrane potential for the channels shown in A and B. The slope conductances were 285 pS for the mSlo1 tail channel and 243 pS for the mSlo3 tail channel. (D) Histograms of slope conductance measurements from 20 patches containing mSlo1 tail channels and 24 patches containing mSlo3 tail channels. For each plot, the superimposed line represents the fit of a Gaussian function to the histogram, yielding mean slope conductances of 276 ± 4 pS and 238 ± 4 pS for the mSlo1 tail channels and mSlo3 tail channels, respectively. Image published in: Moss BL and Magleby KL (2001) © 2001 The Rockefeller University Press. Creative Commons Attribution-NonCommercial-ShareAlike license Larger Image Printer Friendly View |