XB-IMG-121307
Xenbase Image ID: 121307
|
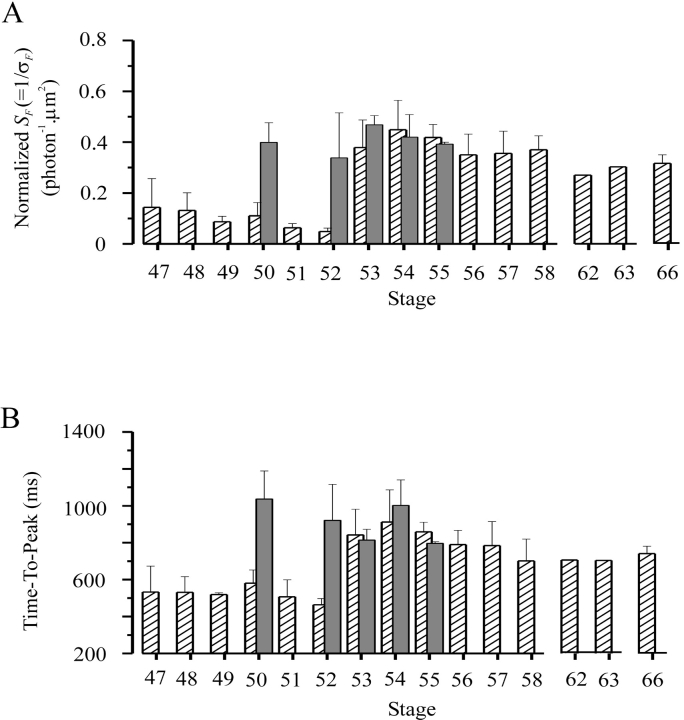
Figure 10. . Collected results on normalized flash sensitivity and time-to-peak of half-saturated flash response of rods after prolonged dark adaptation at various developmental stages. Dark bars indicate the collected results. The number of rods studied at each stage was: 3(stage 50), 2(stage 52), 3(stage 53), 5(stage 54) and 2(stage 55). Hatched bars are redrawn from Fig. 5, B and C. Image published in: Xiong WH and Yau KW (2002) Copyright © 2002, The Rockefeller University Press. Creative Commons Attribution-NonCommercial-ShareAlike license Larger Image Printer Friendly View |