XB-IMG-122908
Xenbase Image ID: 122908

|
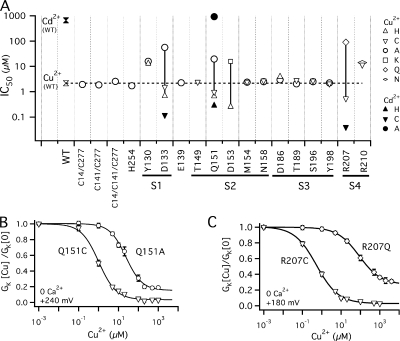
Figure 7. Nonacidic residues also contribute to Cu2+ sensitivity. (A) IC50s of mutant channels are plotted at each position tested for Cu2+ (open symbols) or Cd2+ (filled symbols). Error bars were within the symbol size and therefore excluded. Symbols indicate different substitutions (WT: , ; Ala: ○, •; Lys: □; Gln: ⋄; Asn: ⋄; Cys: ▿,▾; His: ▵, ▴). Dashed line indicates the IC50 of the WT for Cu2+. Vertical solid lines indicate the differences in IC50 between mutants at putative coordination sites. Dose–response relations (GK-[Cu2+]) for putative coordination sites 151 and 207 in 0 Ca2+ are plotted and fit by Hill equations in (B) Q151A (○, IC50 = 23.8 μM, nH =1.0), Q151C (<, IC50 = 0.96 μM, nH = 0.97) at +240 mV and (C) R207Q (⋄, IC50 = 85.8 μM, nH = 0.77) and R207C (<, IC50 = 0.52 μM, nH = 0.77) at +180 mV. Image published in: Ma Z et al. (2008) © 2008 Ma et al. Creative Commons Attribution-NonCommercial-ShareAlike license Larger Image Printer Friendly View |
