XB-IMG-126070
Xenbase Image ID: 126070

|
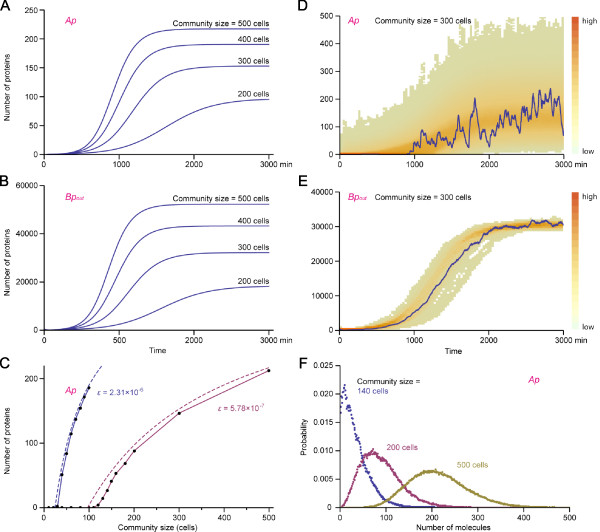
Figure 4. Simulation results of the community effect model. (A, B) Numerical simulations of the deterministic rate equations Eqs.7-14. (A) is the plot for [Ap] and (B) for [Bpout]. Simulation results for different community size are shown. With 100 cells, very little gene expression occurs at steady state (not shown) as 100 cells are close to nc ≈ 97. (C) Average number of Ap at steady state (10000 min) as a function of community size (solid lines). Dotted curves indicate number of Ap at steady state ([Ap]*) obtained by Eqs.35 in additional file 1. Plots are shown for ε = 2.31 × 10⁻⁶ and 5.78 × 10⁻⁷. (D, E) Time series of [Ap] and [Bpout] as overlays of 100 stochastic simulation results (temperature map) for community size of 300 cells and ε = 5.78 × 10 -7. Solid lines show a typical simulation result. (F) Probability distributions of [Ap] at steady state (t = 10000 min in stochastic simulations) for community size n = 140, 200, and 500 cells. ε = 5.78 × 10 -7. All simulations in this figure are with one gene copy each for gene A and gene B. Image published in: Saka Y et al. (2011) Copyright ©2011 Saka et al; licensee BioMed Central Ltd. Creative Commons Attribution license Larger Image Printer Friendly View |
