XB-IMG-125148
Xenbase Image ID: 125148
|
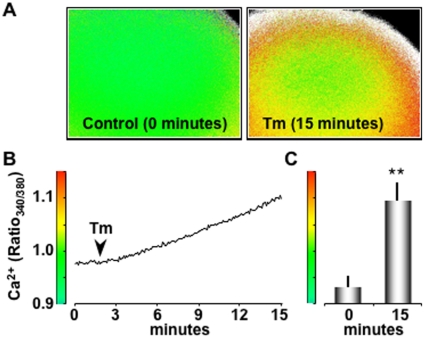
Figure 2. Tm treatment increases cytosolic Ca2+.(A) Images of Fura-2 loaded oocytes before (0 minutes) and after (15 minutes) Tm treatment. Ca2+ levels are presented as fura-2 fluorescence ratios of 340 to 380 nm excitation. The intensity scale bar for these images is presented in B and C. (B) Time course of Fura-2 ratio (Ratio340/380) changes in response to Tm treatment (2.5 µg/ml, added at arrow). (C) Histogram of the average Ratio340/380 (n = 9 oocytes, pooled from 3 independent experiments) at rest (0 minutes) and after Tm treatment (15 minutes). Image published in: Bollo M et al. (2010) Bollo et al. Creative Commons Attribution license Larger Image Printer Friendly View |