XB-IMG-123019
Xenbase Image ID: 123019

|
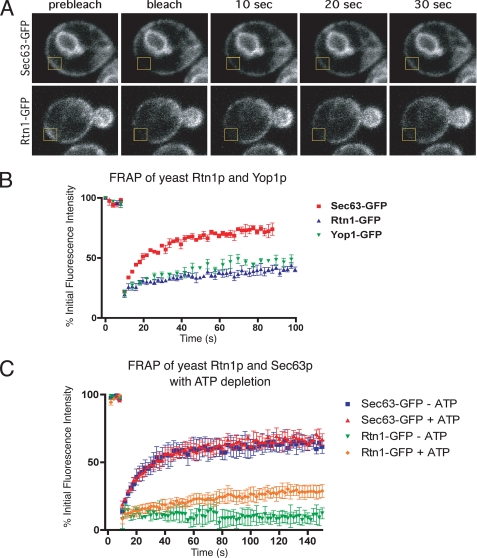
FIGURE 1. Rtn1p and Yop1p have slow diffusional mobility in the ER of yeast cells. A, typical FRAP of Sec63-GFP or Rtn1-GFP in S. cerevisiae cells expressed at endogenous levels. Images were taken before and then after the photobleach for the times indicated. The boxed region shows the area that was photobleached. B, fluorescence intensities normalized to prebleach values of FRAP analyses on yeast Sec63-GFP, Rtn1-GFP, and Yop1-GFP were plotted over time. Error bars indicate ± S.E.; n = 4 cells. C, fluorescence intensities normalized to prebleach values plotted over time of FRAP analyses on yeast Rtn1p in ATP-depleted (green) or non-depleted (orange) cells, compared with that of Sec63p-GFP (ATP depleted in blue; non-depleted in red). Error bars indicate ± S.E., n = 4 cells. Image published in: Shibata Y et al. (2008) Copyright © 2008, The American Society for Biochemistry and Molecular Biology, Inc. Creative Commons Attribution-NonCommercial license Larger Image Printer Friendly View |
