XB-IMG-169922
Xenbase Image ID: 169922
|
|
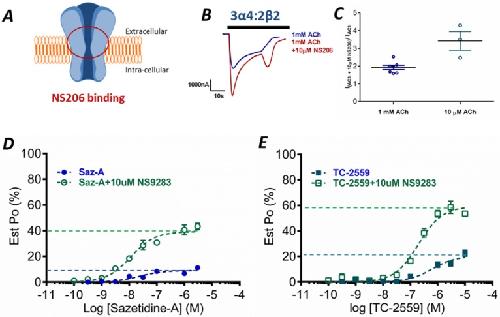
Fig 3. Estimation of open probability.A Schematic depicting the hypothesized areas for NS206 binding [34]. B Representative current trace of the response of the 3α4:2β2 receptor to 1 mM ACh (blue) and 1 mM ACh co-applied with 10 μM NS206 to estimate open channel probability. C The level of NS206 (10μM) positive modulation of ACh currents for the WT. D Saz-A and E TC-2559 concentration-response curves in the absence (blue) and presence (green) of 10 μM NS9283 normalized to 1 mM ACh co-applied with 10 μM NS206 (Est Po,max) at 3α4:2β2 receptors. Dots represent the mean ± s.e.m. Image published in: Indurthi DC et al. (2016) © 2016 Indurthi et al. Creative Commons Attribution license Larger Image Printer Friendly View |