XB-IMG-133133
Xenbase Image ID: 133133
|
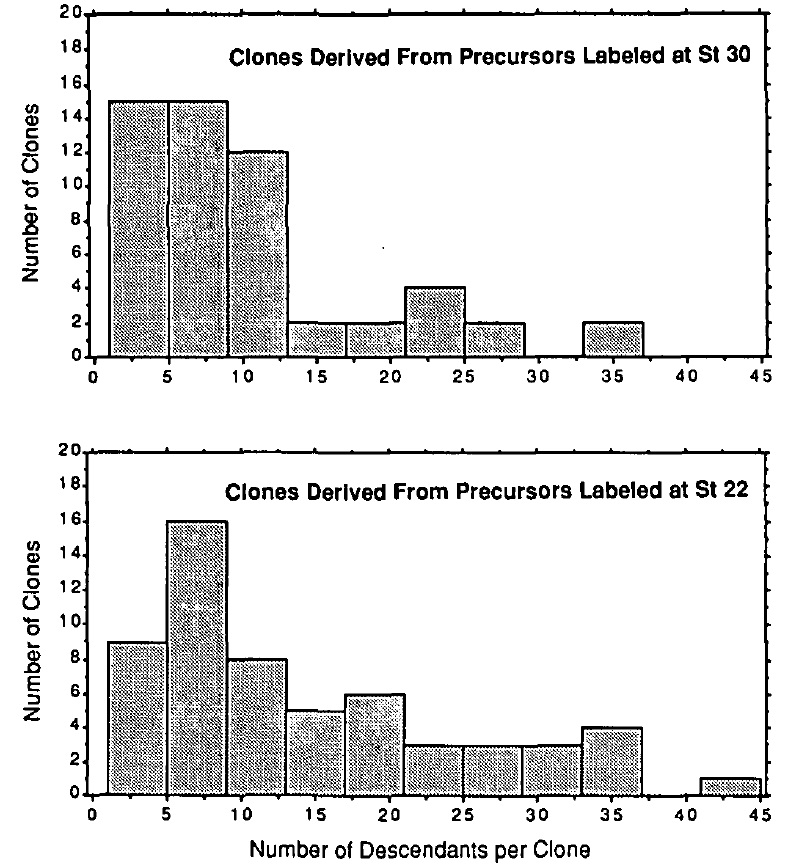
Fig. 2. Histograms of the frequency distributions of clone
sizes for precursors labelled at the optic vesicle (St 22) and
the optic cup (St 30) stages. Precursors labelled at St 30
(top histogram) produce more small clones and fewer large
clones than do precursors labelled at St 22 (bottom
histogram). This difference between St 30 and St 22 is not
surprising, because precursors at St 30 have less time to
proliferate before the end of the birthdate period (at St
37). Precursors at both stages produce a relatively wide
range of clone sizes; this wide range suggests that the
regulation of proliferation might involve a stochastic
process. Image published in: Wetts R and Fraser SE (1991) Copyright © 1991. Image reproduced with permission of the Publisher and the copyright holder. This is an Open Access article distributed under the terms of the Creative Commons Attribution License. Larger Image Printer Friendly View |