XB-IMG-119779
Xenbase Image ID: 119779

|
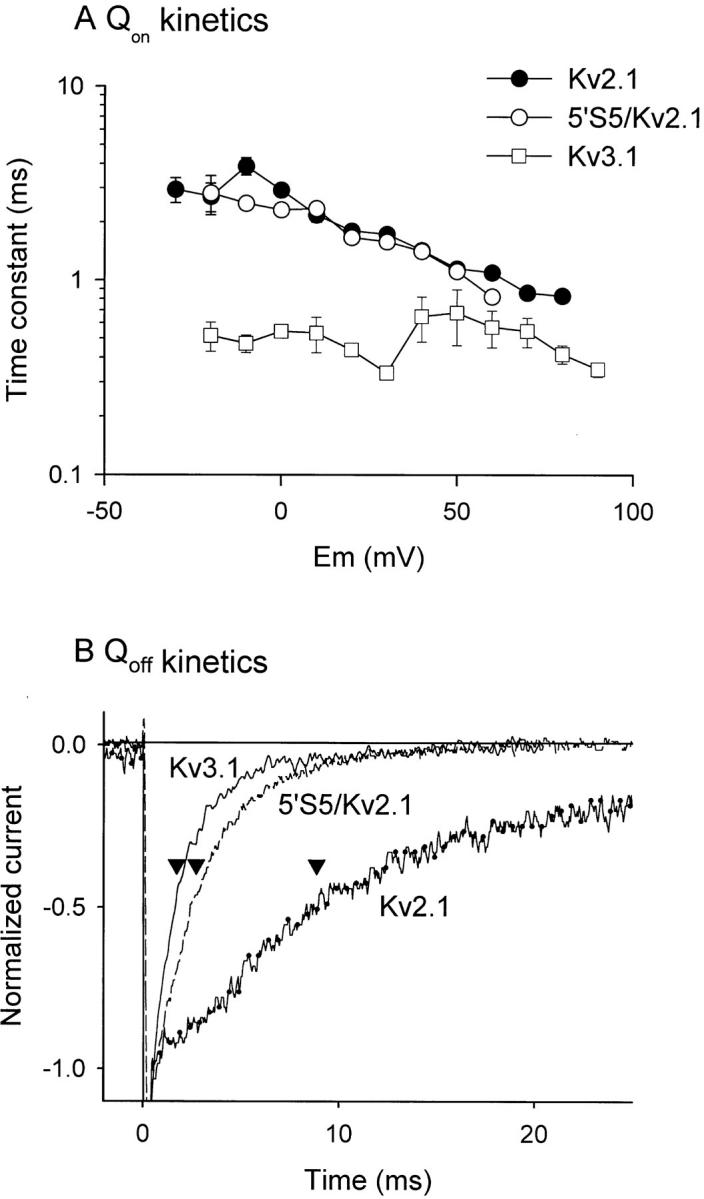
Figure 8. Mutations in 5′S5 selectively affect OFF gating current kinetics. A shows a semilogarithmic plot of the time constant of the major component of Ion decay in Kv2.1 ( filled circles), 5′S5/Kv2.1 (open squares), and Kv3.1 (open triangles) versus test potential. Time constants were obtained by fitting the decay phase of the on-gating current to a biexponential function and at each potential the time constant of the component that accounted for >90% of the decay was selected. Each symbol represents the average of 5–10 patches for each channel. B compares the time course of Ioff decay in peak-normalized Ioff records obtained from Kv3.1 (solid line), 5′S5/Kv2.1 (broken line), and Kv2.1 (dotted line) at a return potential of −90 mV after conditioning steps to produce near maximum activation (+60 mV for Kv3.1, 5′S5/Kv2.1 and +40 mV for Kv2.1). The arrowheads mark the time constants obtained by fitting the traces to monoexponential functions. The average time constants obtained from 5 to 10 membrane patches for each channel was 0.75 ± 0.15, 0.80 ± 0.51, and 8.10 ± 1.39 ms, respectively, in Kv3.1, 5′S5/Kv2.1, and Kv2.1. Image published in: Shieh CC et al. (1997) Image reproduced on Xenbase with permission of the publisher and the copyright holder. Creative Commons Attribution-NonCommercial-ShareAlike license Larger Image Printer Friendly View |
