XB-IMG-125654
Xenbase Image ID: 125654
|
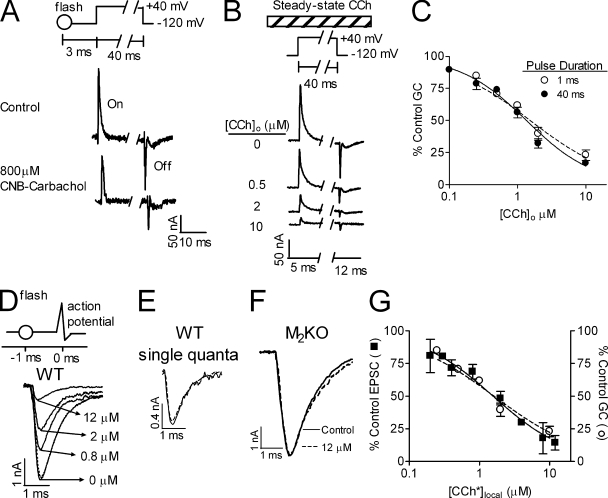
Figure 1. Dependence of GCs and EPSCs on CCh. (A) Representative samples (n = 8) of GCs measured in Xenopus oocytes before (top) and 3 ms after (bottom) flash photolysis of CNB-carbachol (800 µM). “On” = GCs produced during the depolarizing pulse. The flash inhibited the GCs to 61% of control. “Off” = GCs produced upon return to the holding potential. Inset shows the pulse protocol. (B) Samples of GCs at different steady-state [CCh]o measured in the same oocyte. Inset shows the pulse protocol. [CCh]o (bar) was present throughout the experiment. (C) Normalized DIGCs curves for a depolarizing pulse of 40 (•) or 1 (○) ms with steady-state [CCh]o. In each oocyte, GCs were measured in control and with one [CCh]o (n = 3–13 for each point taken from 14 donors). (D) EPSCs recorded in NMJs of WT mice in various [CCh*]local as indicated. Inset shows pulse protocol. The flash (○) was given 1 ms before the action potential. (E) Single quanta (each trace average of 4 quanta) were recorded in control (solid line) and after a flash (dashed line) producing [CCh*]local = 12 µM. (F) EPSCs evoked in M2KO mice before (solid line) and 1 ms after the flash (dashed line) producing 12 µM [CCh*]local. (G) Data as in D presented as percentage of control EPSC (■, n = 4). “○” represents the 1-ms DIGCs curve from B. For all figures, data points represent mean ± SEM. Image published in: Kupchik YM et al. (2011) © 2011 Kupchik et al. Creative Commons Attribution-NonCommercial-ShareAlike license Larger Image Printer Friendly View |