XB-IMG-194837
Xenbase Image ID: 194837

|
|
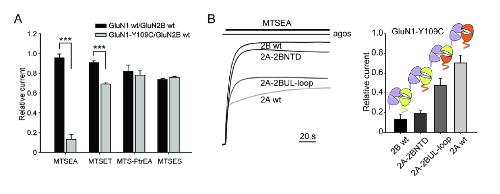
Fig. S5. Subunit specific changes in receptor activity induced by MTSEA binding to the GluN1-
Y109C mutant.
(A) MTS reagent current modifications at GluN2B receptors containing either wild-type (wt) GluN1 or GluN1-
Y109C mutant subunits. Values from left to right are: 0.95 ± 0.04, 0.13 ± 0.05 for MTSEA; 0.91 ± 0.02, 0.69 ± 0.01
for MTSET; 0.82 ± 0.07, 0.78 ± 0.04 for MTS-PtrEA, 0.74 ± 0.01, 0.76 ± 0.01 for MTSES. n=3-8 for each group.
(B) Left panel: UV modification of current carried by receptors containing GluN1-Y109AzF subunits and GluN2A
wt (1.12 ± 0.24), GluN2B (0.28 ± 0.05), GluN2A-2BUL (1.06 ± 0.07), GluN2B-2ANTD (1.16 ± 0.06), GluN2B2A(NTD+L) (1.11 ± 0.09) or GluN2A-2B(NTD+L) (0.68 ± 0.08). n=3-16 for each group. Right panel: MTSEA
modification at GluN1-Y109C receptors containing various GluN2 subunits. Values are: GluN2A wt (0.70 ± 0.08),
GluN2B wt (0.13 ± 0.05), GluN2A-2BUL (0.52 ± 0.04), GluN2B-2ANTD (0.59 ± 0.01), GluN2B-2A(NTD+L) (0.58 ±
0.13), GluN2A-2B(NTD+L) (0.23 ± 0.03). n = 3-12 for each group. Error bars represent the S.D. ***P<0.001,
Student’s t-test. Only the MTS-specific irreversible component of the inhibitory effects on receptor activity is taken
into account for the calculation of relative currents (see SI Material and Methods). Image published in: Zhu S et al. (2014) Copyright © 2014. Image reproduced with permission of the Publisher. Larger Image Printer Friendly View |
