XB-IMG-121276
Xenbase Image ID: 121276
|
|
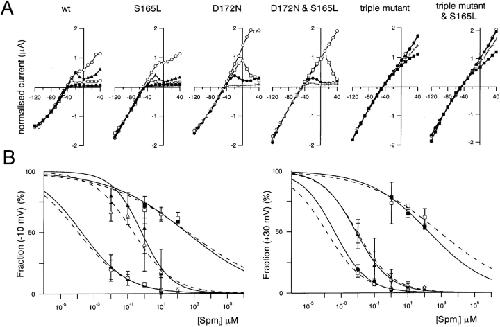
Figure 6. . Comparison of the susceptibility of macroscopic currents through wild-type and mutant Kir2.1 to blockade by intracellular spermine. (A) Normalized I-V relationships; values were measured 3 s after the onset of each step pulse. Current amplitudes were normalized to the values at −90 mV. The symbols stand for spermine concentrations of 0 μM (○), 0.01 μM (▴), 0.1 μM (□), 1 μM (•) 10 μM (+) and 100 μM (▪). (B) Concentration-response relationships for spermine blockade of outward K+ currents at −10 mV (left) and 30 mV (right). A rectification index was calculated first as the ratio of the current amplitudes at −10 mV or 30 mV to that at −90 mV. A value of 1 was then set as 100% for the data at −10 mV (left), and a value of 2 was set as 100% for the data at +30 mV (right). Symbols depict means ± SD (n = 3–7) for wild-type (•), S165L (○), D172N (▴), D172N & S165L (▵), triple mutant (▪), and triple mutant & S165L (□) channels. Solid lines (S165) and dotted lines (with S165L mutation) are curves fitted to Hill's equation. Image published in: Fujiwara Y and Kubo Y (2002) Copyright © 2002, The Rockefeller University Press. Creative Commons Attribution-NonCommercial-ShareAlike license Larger Image Printer Friendly View |