XB-IMG-122458
Xenbase Image ID: 122458

|
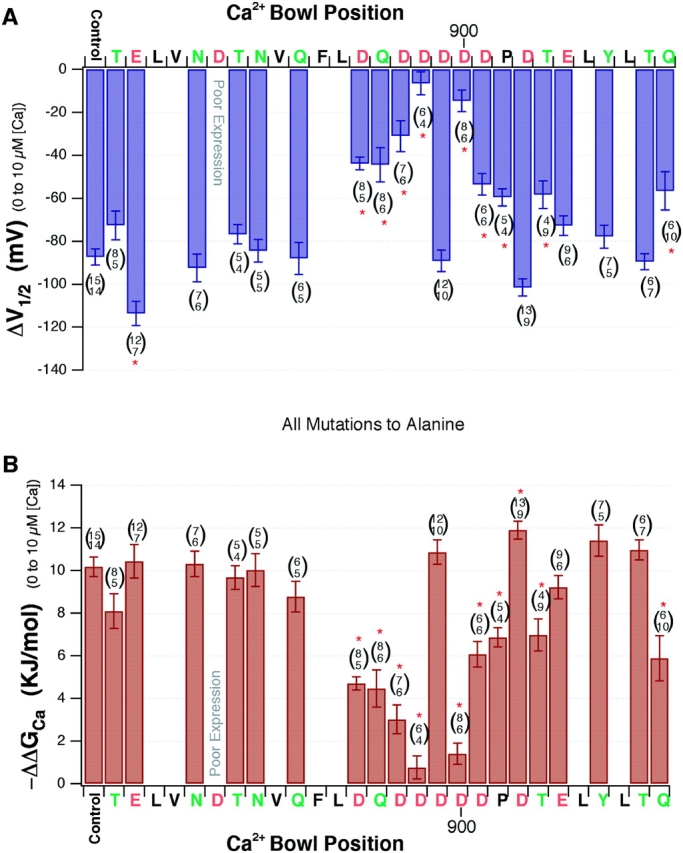
Figure 4. . Summary of the effects of point mutations in the Ca2+ bowl. (A) Change in average V1/2 in response to increasing [Ca2+] from 0.003 to 10 μM for each of a series of point mutations to alanine in the Ca2+ bowl. Each mutated amino acid and its position in the Ca2+ bowl is indicated along the horizontal axis. Residues with acidic side-chains are indicated in red. Other oxygen-containing side chains are indicated in green. Side-chains without oxygen are indicated in black. Mutant responses that are statistically significant relative to control (far left) are indicated with an asterisk. The number of measurements (n) for each data point is indicated in parentheses with the upper number indicating n for 10 μM and the lower number indicating n for 0.003 μM [Ca2+]. (B) Effect of raising [Ca2+] from 0.003 to 10 μM on the free-energy difference between open and closed. −ΔΔGCa (0.003–10 μM [Ca2+]) values were determined from G-V fits to Eq. 2 as described in the text. The following constant parameters were used: JC(0) = 0.059; JO(0) = 1.020; z = 0.51; q = 0.4. The dataset used in B is the same as in A. Image published in: Bao L et al. (2004) Copyright © 2004, The Rockefeller University Press. Creative Commons Attribution-NonCommercial-ShareAlike license Larger Image Printer Friendly View |
