XB-IMG-122956
Xenbase Image ID: 122956
|
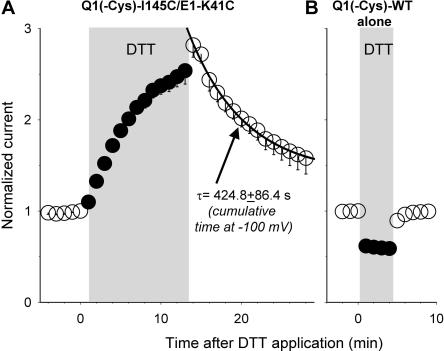
Figure 9. (A) Time course of changes in current amplitudes of Q1(-Cys)-I145C/E1-K41C before, during, and after DTT (10 mM) exposure. Data are averaged from six experiments. Oocyte membrane is pulsed from Vh −100 mV to +60 mV for 2 s, followed by repolarization to −60 mV for 2 s, once every 60 s. Current amplitudes at the end of the +60-mV step is measured and normalized by the control current before DTT exposure. The duration of DTT exposure is denoted by gray shade. The time course of current reduction after DTT washout is fit with a single exponential function (smooth curve superimposed on data points after DTT). The time constant (τ) is converted to cumulative time at Vh −100 mV (when channels are in the resting state). Mean and SEM values of τ are listed in inset. (B) Time course of changes in current amplitude of Q1(-Cys)-WT expressed alone before, during (gray shade), and after exposure to 10 mM DTT. Since there is no Cys in the Q1 channel, this experiment reveals a direct current-suppressing effect of DTT on the Q1 channel. The rapid onset of DTT effect and rapid/complete reversal reflect the time course of DTT equilibration in the bath solution during wash-in and rate of DTT clearance during washout. Image published in: Xu X et al. (2008) © 2008 Xu et al. Creative Commons Attribution-NonCommercial-ShareAlike license Larger Image Printer Friendly View |