XB-IMG-178459
Xenbase Image ID: 178459

|
|
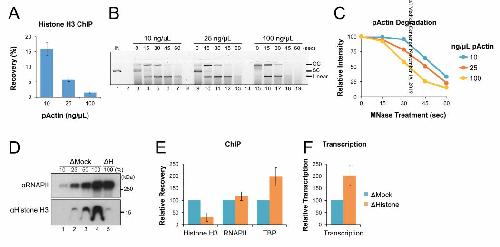
Figure 3. Histone occupancy regulates transcriptional activity in NPE. (A) pActin was incubated in NPE at the indicated concentrations for 30 minutes. DNA-bound protein was then analyzed by ChIP using histone H3 antibodies. (B) pActin was incubated in NPE at the indicated concentrations for 60 minutes. Next, reaction samples were diluted in MNase buffer and treated with 100 U MNase at 37°C for the indicated time. DNA was then isolated and resolved by agarose gel electrophoresis. Input DNA (IN) and topological isoforms of the resolved plasmids are indicated: open circular (OC), supercoiled (SC), and linear. (C) The total intensity of all three full-length plasmid molecules identified in (B) was quantified and graphed. (D) Mock-depleted (ΔMock) and histone-depleted (ΔH) NPE were analyzed by Western blot with the indicated antibodies. (E) pActin was incubated in ΔMock or ΔH extract at 10 ng/µL. At 30 minutes, DNA-bound protein was analyzed by ChIP using the indicated antibodies. (F) RNA was isolated from the reactions in (E) at 120 minutes and quantified by RT-qPCR using the Promoter primers. Error bars represent +/- one standard deviation. Image published in: Barrows JK and Long DT (2019) Copyright © 2019. Image reproduced with permission of the Publisher. Larger Image Printer Friendly View |
