XB-IMG-120670
Xenbase Image ID: 120670
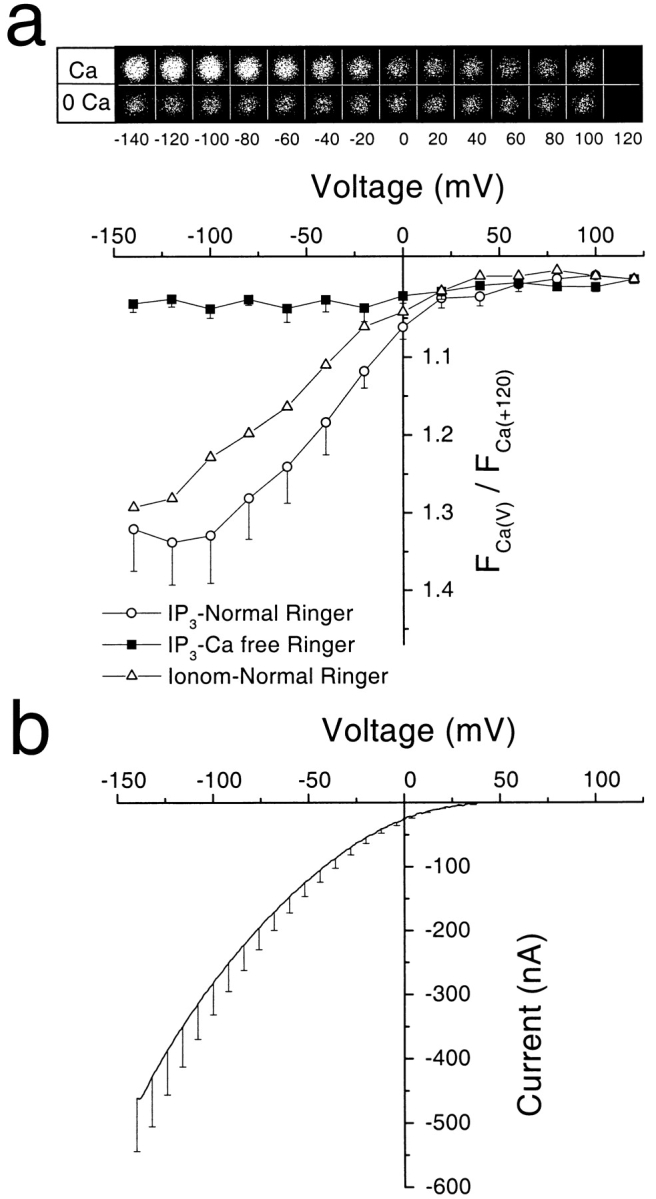
|
Figure 2. Visualization and voltage dependence of store-operated Ca entry. (a) Ca dynamics were imaged by confocal microscopy from a cell injected with Ca-green-1 coupled to 70 kD dextran and voltage clamped. Internal Ca stores were depleted of Ca by injection of 23 nl IP3 (1 mM) (▪ and ○) or by exposure to 14 μM ionomycin (▵). 10 min after IP3 injection, after the wave of Ca release and the development of store-operated Ca entry, the membrane potential was stepped to the indicated voltages from a holding potential of 0 mV (○). The same voltage protocol was repeated after switching the cell to Ca-free solution (▪). The top shows the images of a representative experiment with the voltage indicated below the image. The Nernst equation predicts no influx at +120 mV. Therefore, the image at +120 mV was taken as background fluorescence and was subtracted from the images at the other voltages. In the bottom, total fluorescence at each voltage was measured and normalized to the fluorescence at +120 mV. Fluorescence intensity was plotted (mean ± SEM) as a function of voltage (n = 4) for Ca-free (▪) and Ca-containing (○) solution. (b) Current–voltage relationship for ISOC measured by a ramp voltage pulse from −150 to +100 mV from cells loaded with 5 mM BAPTA to inhibit the Ca-activated Cl currents, and voltage clamped. The mean current ± SEM was plotted as a function of voltage (n = 4). Image published in: Machaca K and HC Hartzell null (1999) Image reproduced on Xenbase with permission of the publisher and the copyright holder. Creative Commons Attribution-NonCommercial-ShareAlike license Larger Image Printer Friendly View |