XB-IMG-125069
Xenbase Image ID: 125069
|
|
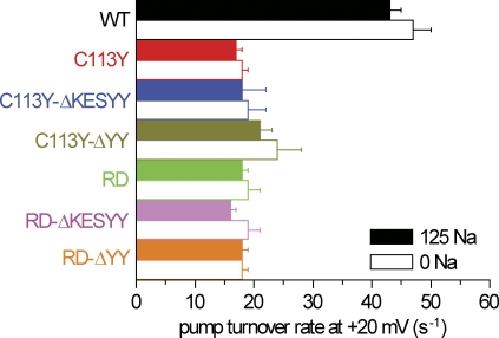
Figure 7. Summary of maximal Na/K pump turnover rates at 22–24°C estimated by normalizing ouabain-sensitive Na/K pump currents at 20 mV and 15 mM [Ko] obtained with or without Nao to the total ouabain-sensitive charge moved between voltage extremes in the same oocyte in a Ko-free 125-mM Nao solution (e.g., Fig. 8, D and H) taken as a measure of the number of Na/K pumps in the membrane. With Nao, closed bars; without Nao, open bars. The estimates assume 3Na:2K stoichiometry during pumping and the pre–steady-state movement at 0 mM [Ko] of zq net charges (for WT, zq = 0.93 ± 0.03; for RD and C113Y pumps with or without C-terminal truncations, mean zq = 0.65 ± 0.01; values taken from Fig. 9, A and B) across the electric field of the membrane between extreme positive and negative potentials; unless these parameters differ between pump types, the estimates are expected to be proportional to true turnover rates. Estimated rates for WT pumps (black) are at least twice those for all other pumps, regardless of the presence or absence of Nao or of C-terminal truncations. Rate estimates in the presence and absence of Nao, respectively, averaged as follows: WT, 43 ± 2 s−1 and 47 ± 3 s−1, n = 5; C113Y (red), 17 ± 1 s−1 and 18 ± 1 s−1, n = 7; C113Y-ΔKESYY (blue), 18 ± 4 s−1 and 19 ± 3 s−1, n = 8; C113Y-ΔYY (olive), 21 ± 2 s−1 and 24 ± 4 s−1, n = 5; RD (green), 18 ± 1 s−1 and 19 ± 2 s−1, n = 5; RD-ΔKESYY (magenta), 16 ± 1 s−1 and 19 ± 2 s−1, n = 8; RD-ΔYY (orange), 18 ± 1 s−1 and 18 ± 1 s−1, n = 3. Error bars represent SEM. Image published in: Vedovato N and Gadsby DC (2010) © 2010 Vedovato and Gadsby. Creative Commons Attribution-NonCommercial-ShareAlike license Larger Image Printer Friendly View |