XB-IMG-124672
Xenbase Image ID: 124672
|
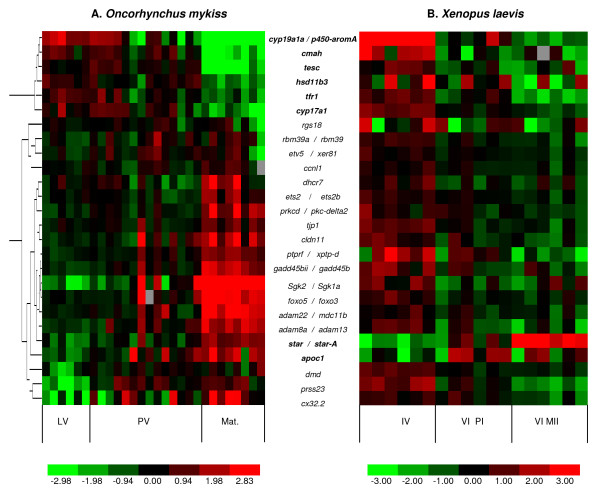
Figure 2. Expression of 26 genes assessed by real-time PCR in Oncorhynchus mykiss and Xenopus laevis ovarian samples. QPCR analysis of the 26 candidate genes in rainbow trout (A) ovary during late vitellogenesis (LV, n = 6), post-vitellogenesis (PV, n = 14) and during maturation (Mat., n = 8), and in Xenopus (B) ovarian follicles at stage IV, stage VI and after oocyte maturation (metaphase-II arrested oocytes) from six adult females. Data were normalized to the abundance of 18S, log2-transformed, and median-centered prior to the clustering analysis. The expression data sets have been supervised according to oogenesis stage. Genes with similar expression profiles in both species are bolded. The dendrograms on the left represent correlation distances between the profiles of studied trout genes. For each gene the expression level within sample set is indicated using a color density scale. Red and green are used for over- and under-expression respectively, while black is used for median expression (grey boxes, not determined). Image published in: Gohin M et al. (2010) Copyright ©2010 Gohin et al; licensee BioMed Central Ltd. Creative Commons Attribution license Larger Image Printer Friendly View |