XB-IMG-122459
Xenbase Image ID: 122459
|
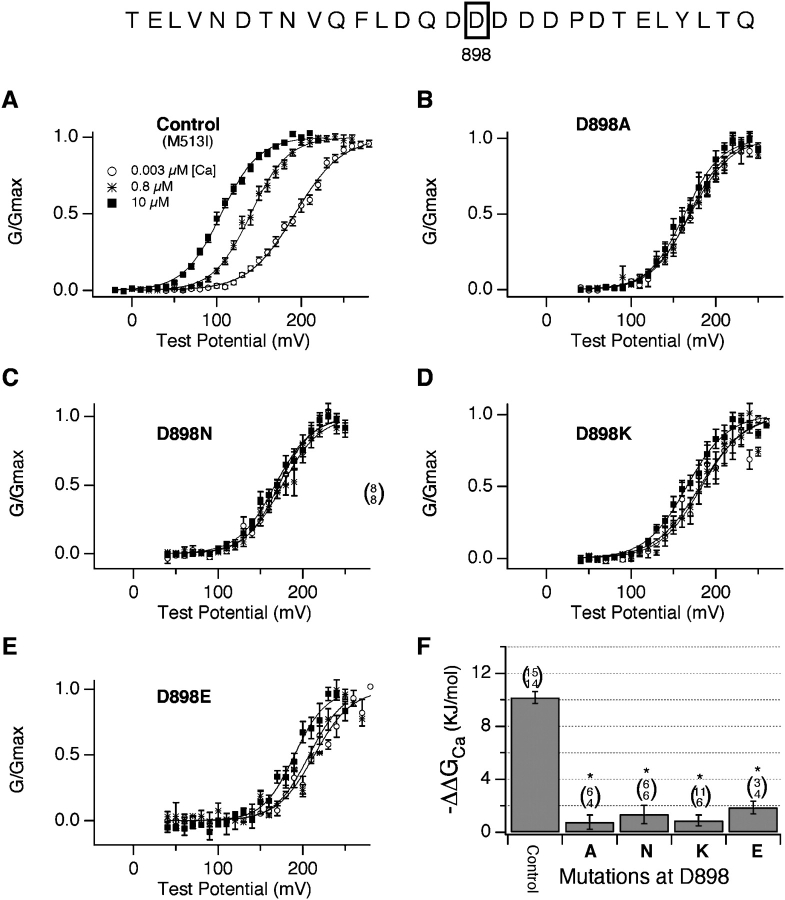
Figure 5. . Ca2+ sensing is very sensitive to the nature of the residue at position 898. G-V curves determined for (A) the control (M513I) channel, and (B–E) four mutations at position 898 as indicated. (F) The effect of raising [Ca2+] from 0.003 μM to 10 μM on the free-energy difference between open and closed. −ΔΔGCa (0.003–10 μM [Ca2+]) values were determined as described in the text. Control: as in the legend to Fig. 2. D898A: as in the legend to Fig. 3. D898N: 0.003 μM [Ca2+] V1/2 = 172 mV, z = 1.28; 0.8 μM [Ca2+] V1/2 = 176 mV, z = 1.15; 10 μM [Ca2+] V1/2 = 168 mV, z = 1.16. D898K: 0.003 μM [Ca2+] V1/2 = 181 mV, z = 0.95; 0.8 μM [Ca2+] V1/2 = 184 mV, z = 1.02; 10 μM [Ca2+] V1/2 = 166 mV, z = 1.05. D898E: 0.003 μM [Ca2+] V1/2 = 214 mV, z = 1.15; 0.8 μM [Ca2+] V1/2 = 208 mV, z = 1.25; 10 μM [Ca2+] V1/2 = 191 mV, z = 1.35. Image published in: Bao L et al. (2004) Copyright © 2004, The Rockefeller University Press. Creative Commons Attribution-NonCommercial-ShareAlike license Larger Image Printer Friendly View |