XB-IMG-127814
Xenbase Image ID: 127814
|
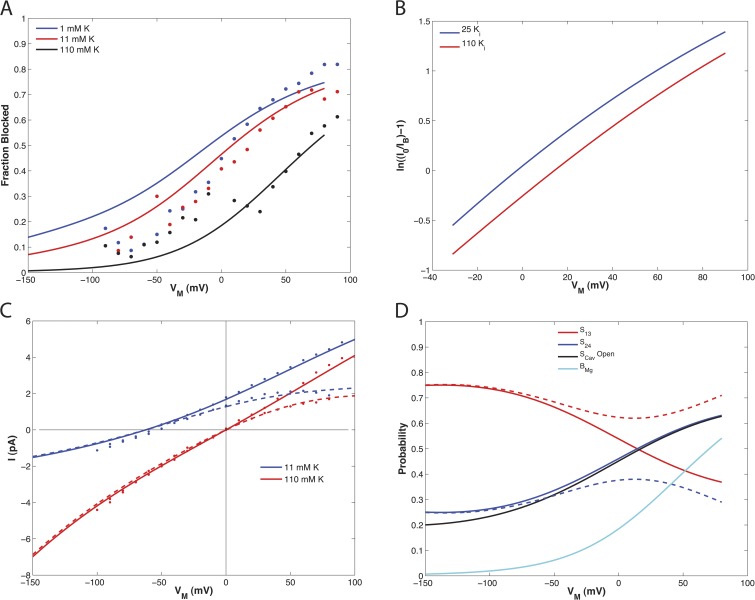
Figure 8. Results for block of Kir1.1 by Mg2+ and Na+ are simulated with a kinetic model for permeation, with blocker binding to the transmembrane cavity. (A) Fractional block by Mg2+ at different voltages and values of [K+]o. (B) Predicted voltage dependence of Mg2+ block at 110 and 25 mM [K+]in. (C) Currents with [K+]o = 110 mM (red) or 11 mM (blue) and 110 mM of internal K+ with (dashed lines) and without (solid lines) 40 mM Na+. Symbols represent data points. Solid lines show predictions of model parameters listed in Table S2. (D) Predicted occupancies of K+ ions in the S1/S3 positions (red) and S2/S4 positions (blue) in the absence (solid lines) and presence (dashed lines) of 1 mM Mg2+. The black line shows the fraction of unoccupied cavity sites in the absence of Mg2+. The green line indicates the fraction of blocked channels. Image published in: Yang L et al. (2012) © 2012 Yang et al. Creative Commons Attribution-NonCommercial-ShareAlike license Larger Image Printer Friendly View |