XB-IMG-123714
Xenbase Image ID: 123714
|
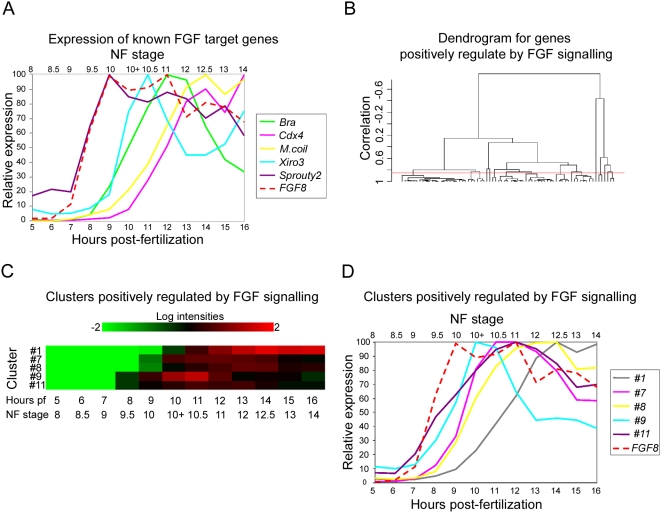
Figure 5. Cluster analysis of genes down regulated in response to FGF inhibition.(A) shows the temporal expression profiles of FGF8 (dashed line) and several known FGF target genes from blastula stage 8 until early neurula stage 14 (5 to 16 hours pf at 23°C). Profiles are derived from normalised microarray expression levels. Relative expression values are represented as percentages of the maximum expression value for each gene. (B) is a cluster dendrogram generated within BRB-ArrayTools for genes that are significantly down regulated in response to FGF inhibition i.e. positively regulated by FGF signaling. The red line indicates the level at which the dendrogram was cut, corresponding to a correlation coefficient of 0.85. (C) is a heat map of temporal expression for gene clusters positively regulated by FGF signalling. Only clusters containing ≥5 members are presented. Values at each time point from blastula stage 8 to early neurula stage 14 are derived from the mean of the expression levels for all the genes in each cluster. (D) shows the temporal expression profiles of FGF8 and gene clusters positively regulated by FGF signalling based upon the mean of the expression levels for all the genes in each cluster. Image published in: Branney PA et al. (2009) Branney et al. Creative Commons Attribution license Larger Image Printer Friendly View |